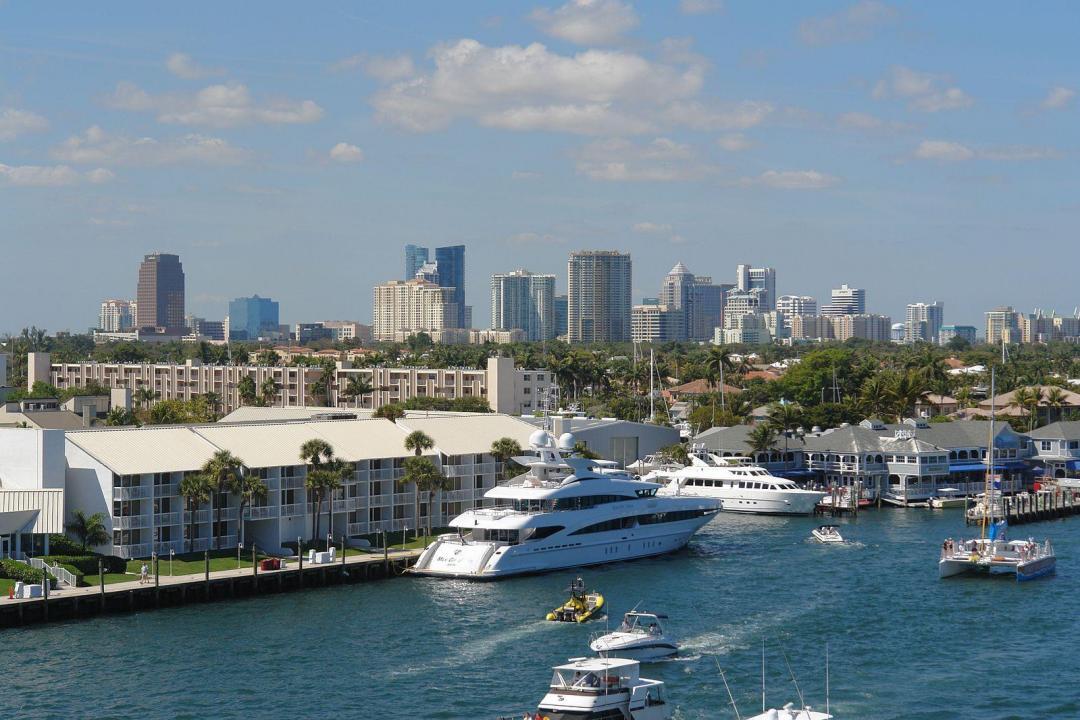
Metros where homes are selling for the most under asking price

Sean Pavone // Shutterstock
Metros where homes are selling for the most under asking price
It’s a tough time to be in the market for a new house.
The average 30-year fixed rate mortgage rose above 7% at the start of November as the Federal Reserve has raised its benchmark rates month after month to combat inflation. Even a half of a percentage point increase can have an outsized impact on the monthly payments required for a mortgage.
Since mortgage rates have been under 4% for the better part of the last decade, homebuyers have locked in mortgage rates that are far more affordable than what’s suddenly on offer in today’s high rate environment. And sellers aren’t exactly coming down on price – home prices are still increasing, just more slowly than they did from 2020-2021.
And yet there are still metro areas where home buyers are finding homes selling for below asking price.
Stacker analyzed data from Redfin to see which metros had the most homes sold under asking price. Data shows sales for the week ending 11/06/22. Metros where fewer than 12 homes were sold were excluded from this list. Metros are ranked based on the average sale to list ratio. This is a mean ratio of the home sale price divided by the list price.
In the first week of November 1,676 homes were sold across the 50 metro areas analyzed for a median sale price of just over $260,000.
You may also like: Comparing minimum wage to the cost of living in every state
![]()
Kolossos // Wikimedia Commons
#50. Miami, FL metro area
– Average sale to list ratio: 0.962
– Total homes sold: 420
– Median sale price: $485,000

huangcolin // Shutterstock
#49. Clearlake, CA metro area
– Average sale to list ratio: 0.961
– Total homes sold: 16
– Median sale price: $282,500

WeaponizingArchitecture // Wikicommons
#48. Saginaw, MI metro area
– Average sale to list ratio: 0.961
– Total homes sold: 36
– Median sale price: $143,500
rossograph // Wikimedia Commons
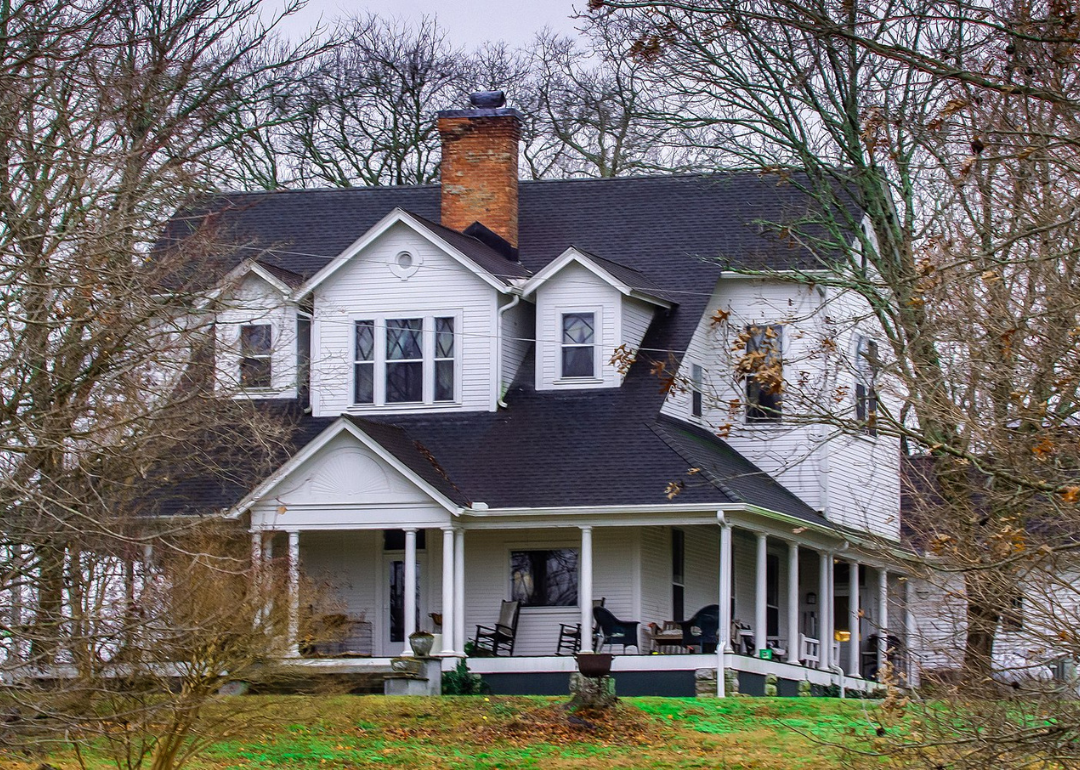
#47. Shelbyville, TN metro area
– Average sale to list ratio: 0.961
– Total homes sold: 14
– Median sale price: $299,450
Jmancuso // Wikimedia Commons
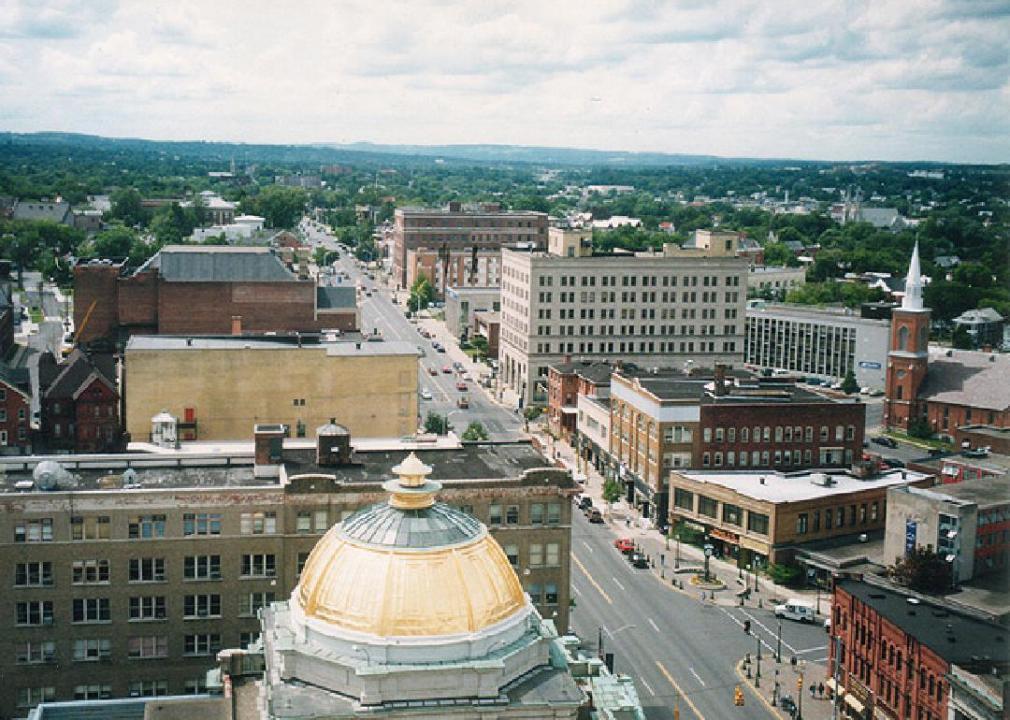
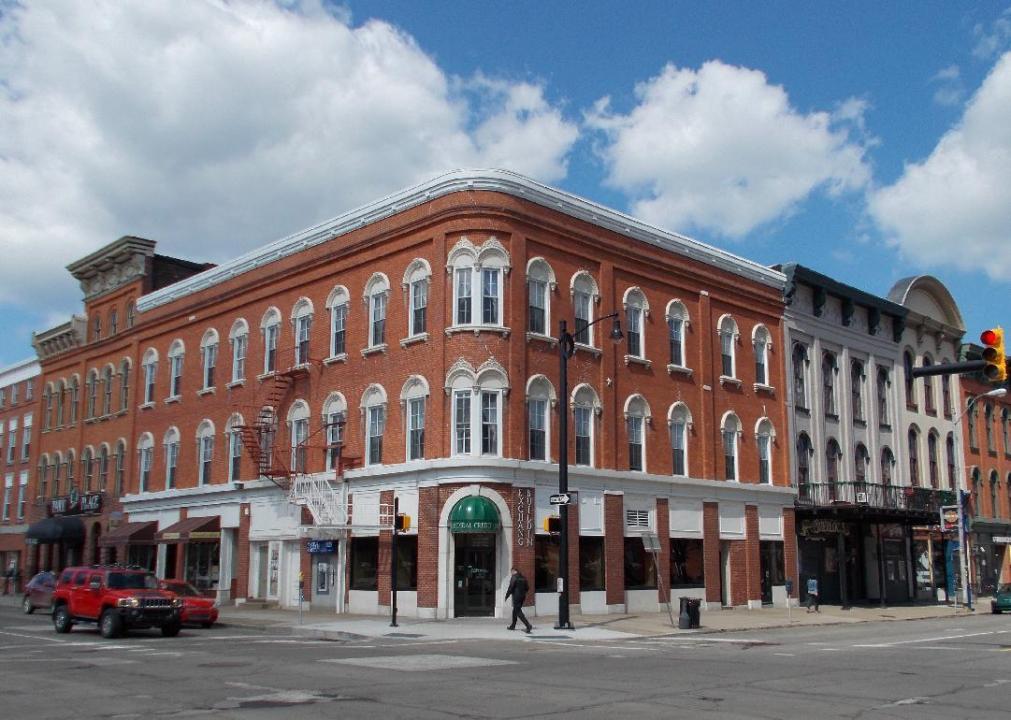
#46. Utica, NY metro area
– Average sale to list ratio: 0.961
– Total homes sold: 37
– Median sale price: $182,500
You may also like: Best small towns to live in across America

Roberto Galan // Shutterstock
#45. Jasper, IN metro area
– Average sale to list ratio: 0.960
– Total homes sold: 14
– Median sale price: $224,500
Ulf Nammert // Shutterstock
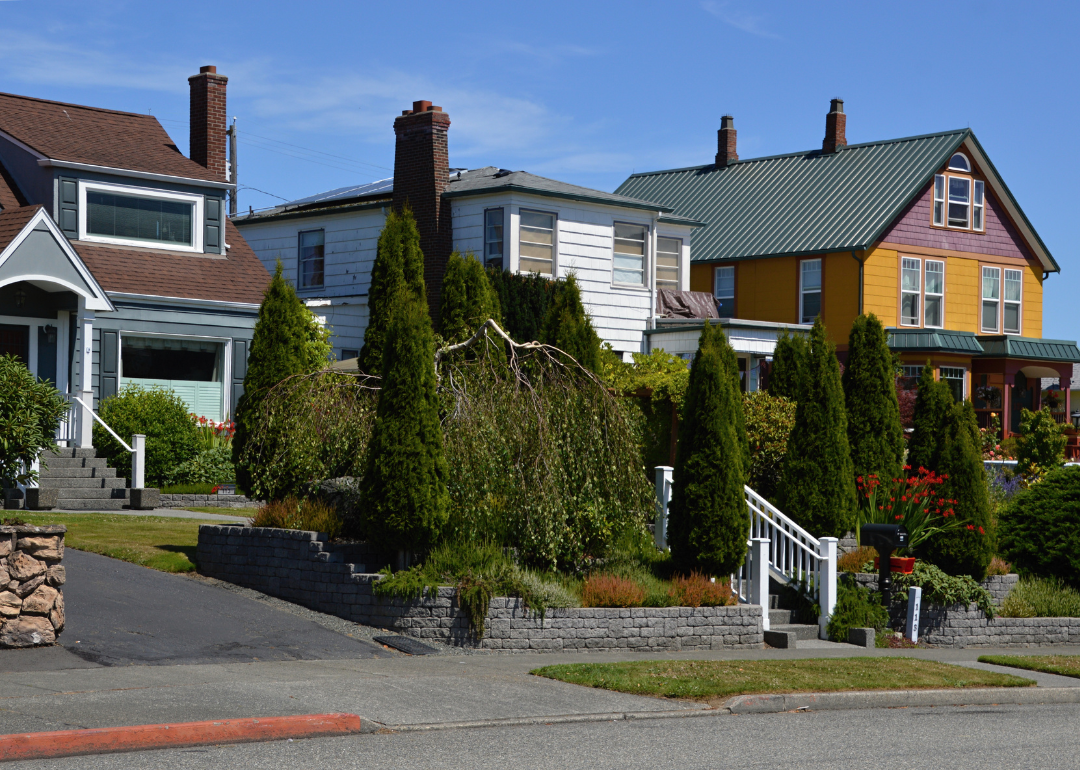
#44. Port Angeles, WA metro area
– Average sale to list ratio: 0.960
– Total homes sold: 14
– Median sale price: $464,500

Michael Deemer // Shutterstock
#43. Indiana, PA metro area
– Average sale to list ratio: 0.959
– Total homes sold: 14
– Median sale price: $165,500
Soglad2005 // Wikimedia Commons
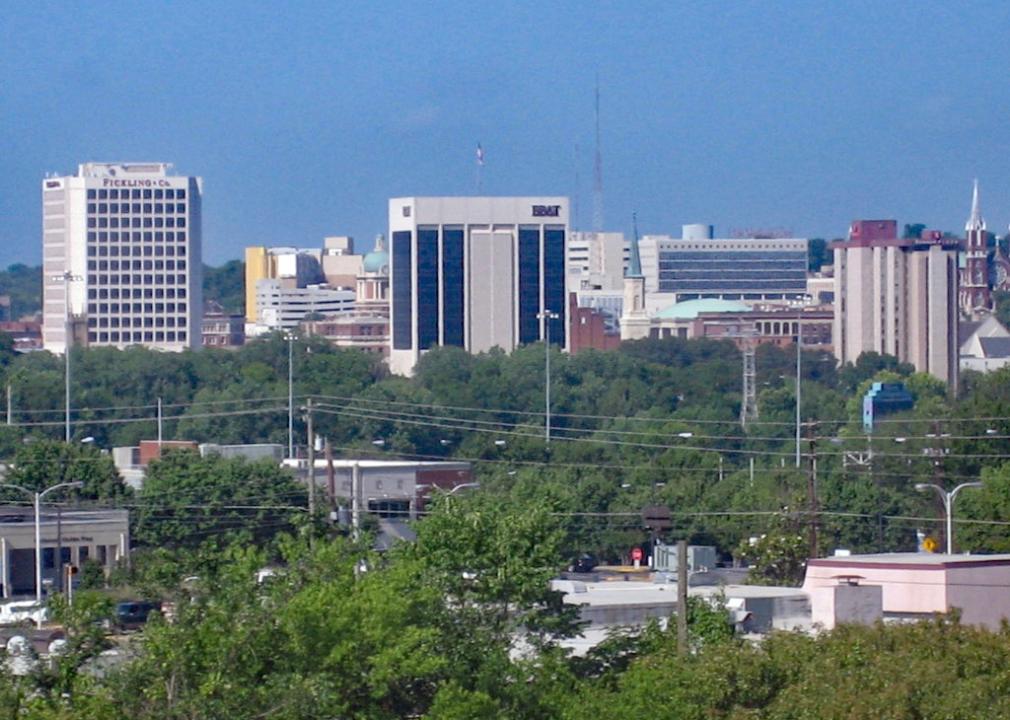
#42. Macon, GA metro area
– Average sale to list ratio: 0.958
– Total homes sold: 41
– Median sale price: $248,000
TheCatalyst31 // Wikimedia Commons
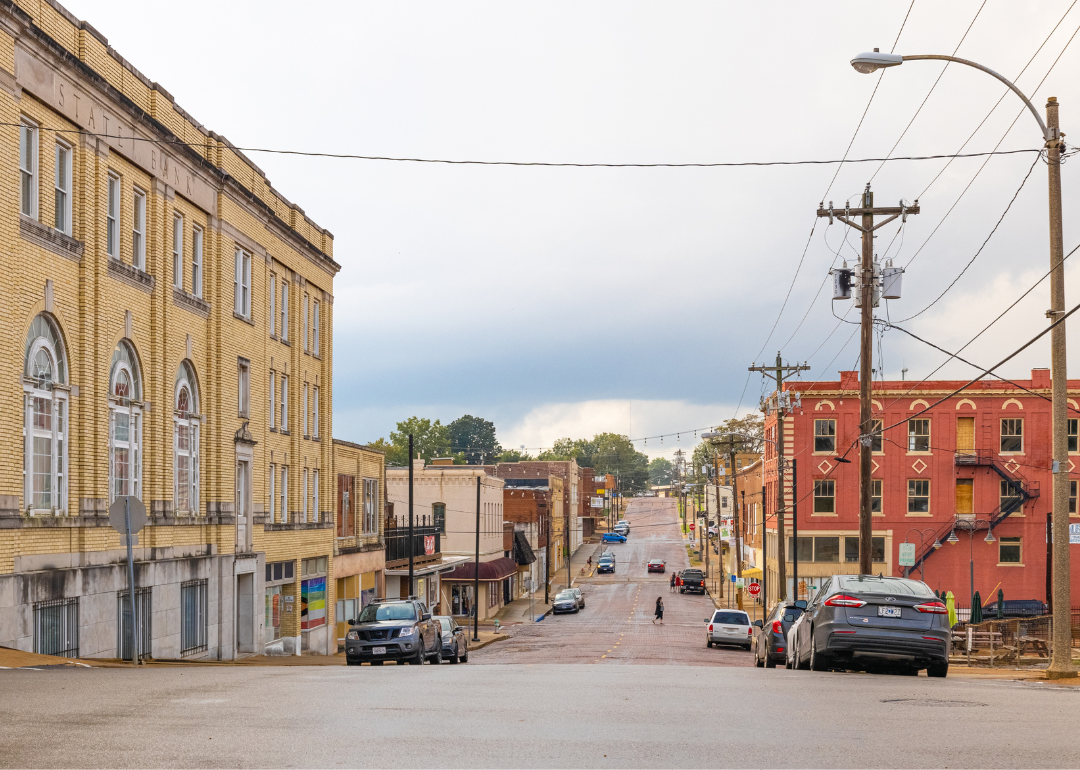
#41. Farmington, MO metro area
– Average sale to list ratio: 0.957
– Total homes sold: 14
– Median sale price: $159,900
You may also like: Best place to live in every state
Jacob Boomsma // Shutterstock
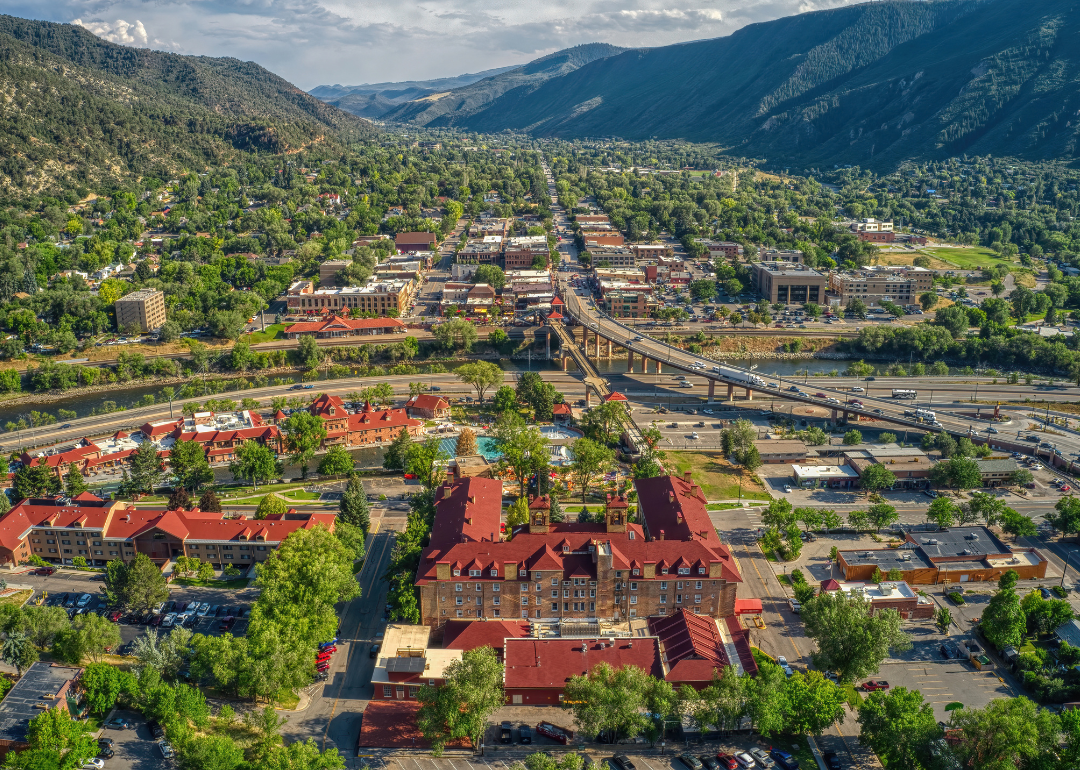
#40. Glenwood Springs, CO metro area
– Average sale to list ratio: 0.957
– Total homes sold: 32
– Median sale price: $737,500

Canva
#39. Muskogee, OK metro area
– Average sale to list ratio: 0.957
– Total homes sold: 16
– Median sale price: $149,200

Canva
#38. Mount Airy, NC metro area
– Average sale to list ratio: 0.957
– Total homes sold: 15
– Median sale price: $239,900

IanSkylake17 // Shutterstock
#37. Ashtabula, OH metro area
– Average sale to list ratio: 0.956
– Total homes sold: 16
– Median sale price: $137,750
OPMaster // Wikimedia Commons
#36. Bowling Green, KY metro area
– Average sale to list ratio: 0.956
– Total homes sold: 23
– Median sale price: $219,000
You may also like: Best places to retire in America

Roman Eugeniusz // Wikimedia Commons
#35. Evansville, IN metro area
– Average sale to list ratio: 0.955
– Total homes sold: 64
– Median sale price: $152,250
Jeffrey B. Banke // Shutterstock
#34. Gardnerville Ranchos, NV metro area
– Average sale to list ratio: 0.955
– Total homes sold: 19
– Median sale price: $690,000
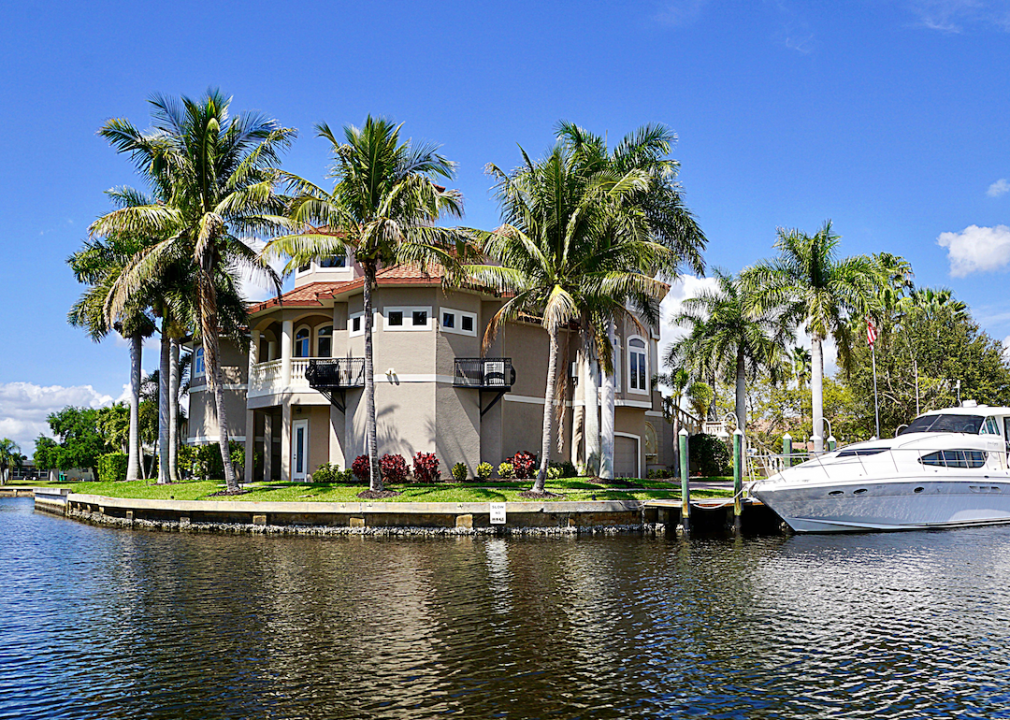
Carol Ann Mossa // Shutterstock
#33. Punta Gorda, FL metro area
– Average sale to list ratio: 0.955
– Total homes sold: 82
– Median sale price: $360,000

Jennifer Gottwald // Wikicommons
#32. Wenatchee, WA metro area
– Average sale to list ratio: 0.954
– Total homes sold: 32
– Median sale price: $521,500

Renelibrary // Wikicommons
#31. Sherman, TX metro area
– Average sale to list ratio: 0.954
– Total homes sold: 32
– Median sale price: $291,500
You may also like: States with the lowest property taxes

Sharon Day // Shutterstock
#30. Hot Springs, AR metro area
– Average sale to list ratio: 0.954
– Total homes sold: 21
– Median sale price: $245,000
IvoShandor // Wikimedia Commons
#29. Sterling, IL metro area
– Average sale to list ratio: 0.954
– Total homes sold: 15
– Median sale price: $103,000

Nile Dean Meservy // Wikimedia Commons
#28. Logan, UT metro area
– Average sale to list ratio: 0.953
– Total homes sold: 24
– Median sale price: $462,500
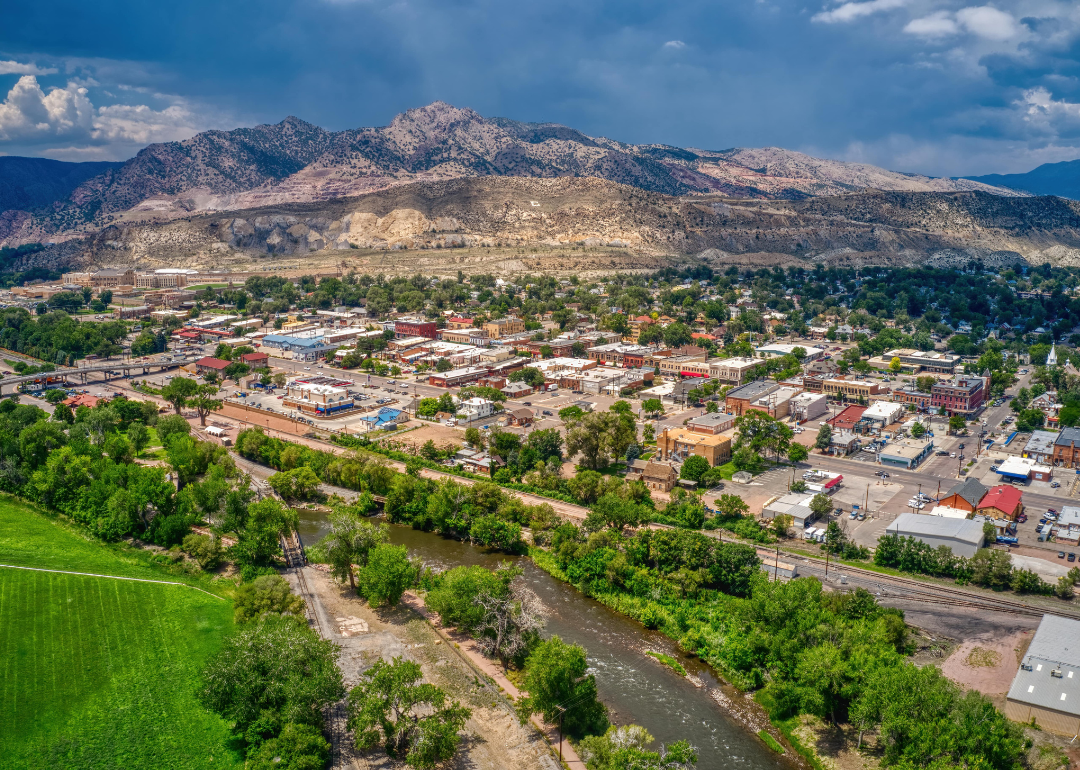
Jacob Boomsma // Shutterstock
#27. Cañon City, CO metro area
– Average sale to list ratio: 0.953
– Total homes sold: 16
– Median sale price: $392,000
pubdog // Wikimedia Commons
#26. Erie, PA metro area
– Average sale to list ratio: 0.953
– Total homes sold: 46
– Median sale price: $149,950
You may also like: What the 50 biggest cities in America looked like 50 years ago
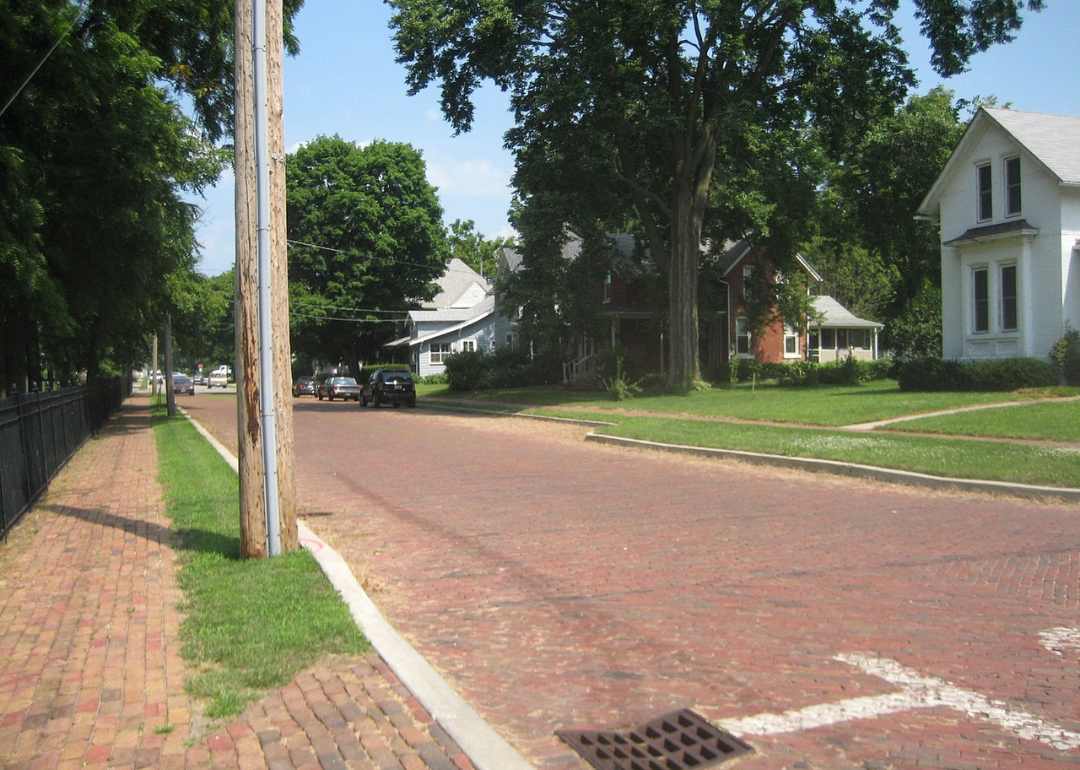
Paul Sableman // Wikimedia Commons
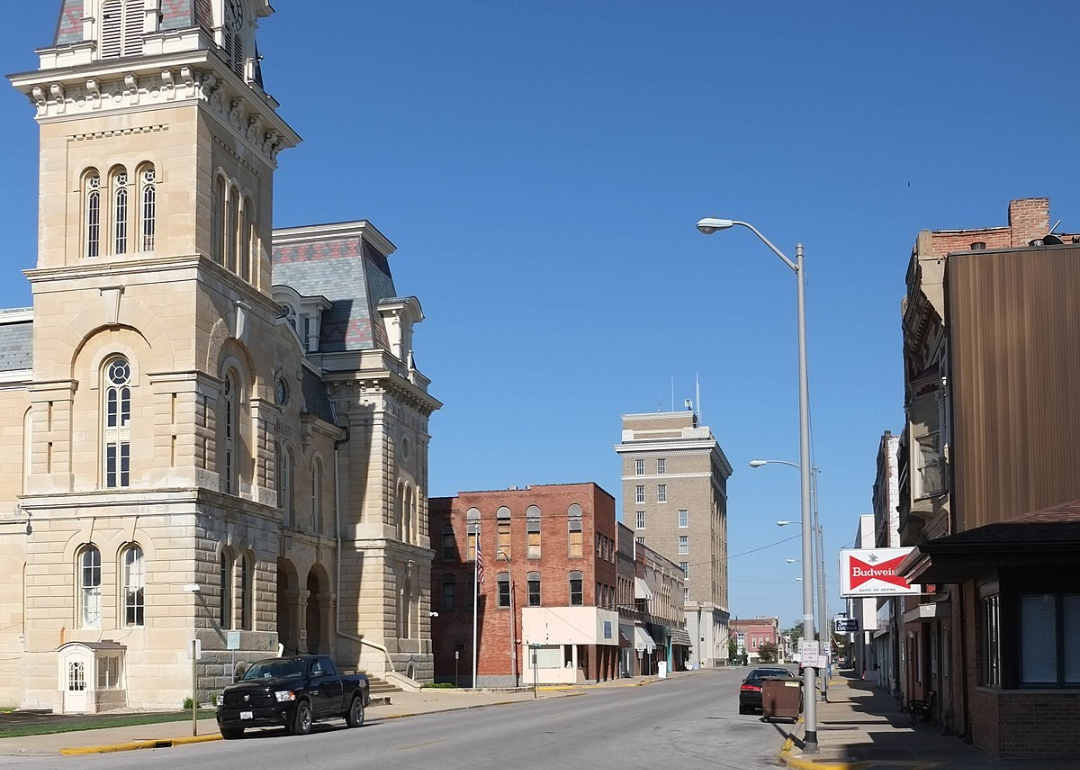
#25. Jacksonville, IL metro area
– Average sale to list ratio: 0.953
– Total homes sold: 16
– Median sale price: $124,750
Acroterion // Wikicommons
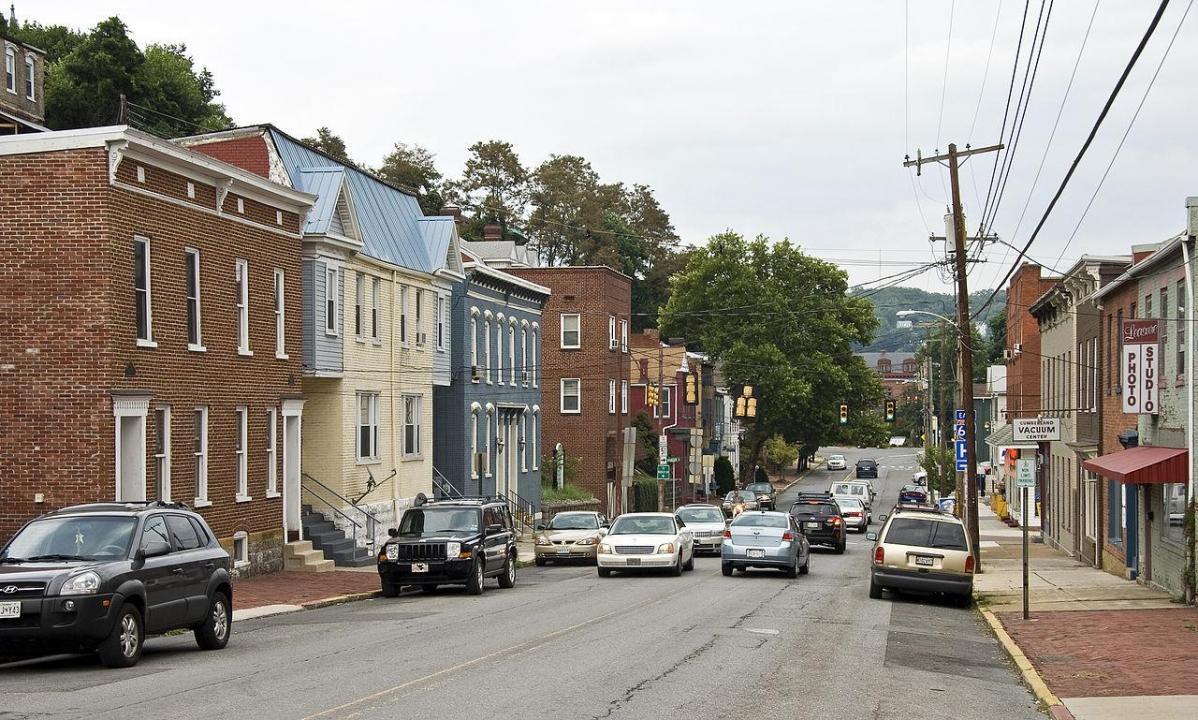
#24. Cumberland, MD metro area
– Average sale to list ratio: 0.952
– Total homes sold: 21
– Median sale price: $120,000
Robert Lawton // Wikimedia Commons
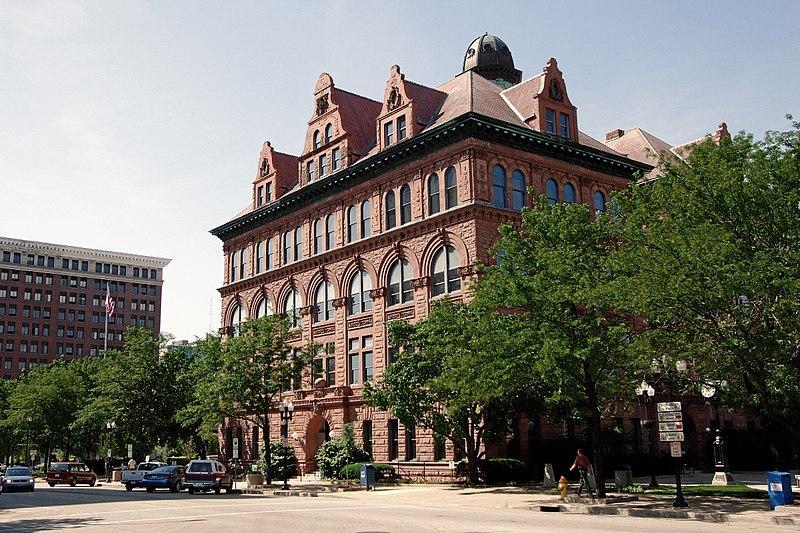
#23. Peoria, IL metro area
– Average sale to list ratio: 0.952
– Total homes sold: 101
– Median sale price: $130,000
Brian Stansberry // Wikimedia Commons
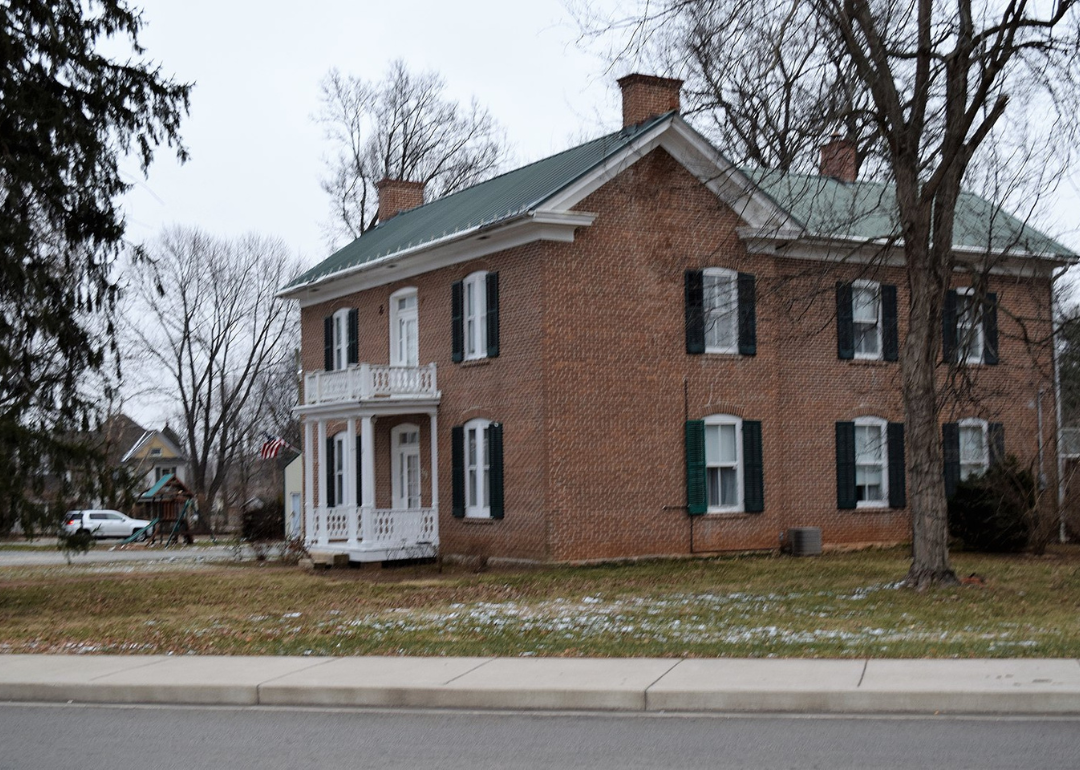
#22. Tullahoma, TN metro area
– Average sale to list ratio: 0.952
– Total homes sold: 24
– Median sale price: $270,000
Spiroview Inc // Shutterstock
#21. Corning, NY metro area
– Average sale to list ratio: 0.951
– Total homes sold: 15
– Median sale price: $166,900
You may also like: Can you guess these famous skylines?

Chris Light // Wikimedia Commons
#20. Owensboro, KY metro area
– Average sale to list ratio: 0.951
– Total homes sold: 23
– Median sale price: $190,000
Hot Furnace // Wikimedia Commons
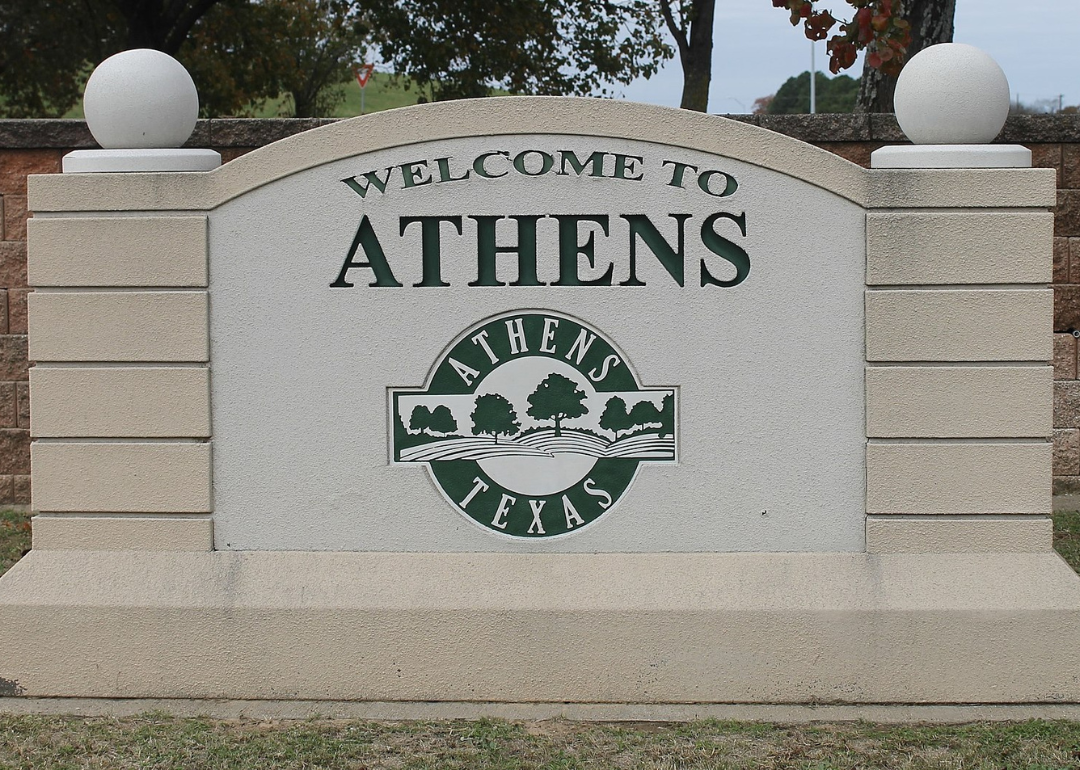
#19. Athens, TX metro area
– Average sale to list ratio: 0.950
– Total homes sold: 21
– Median sale price: $334,990
Stuart Monk // Shutterstock
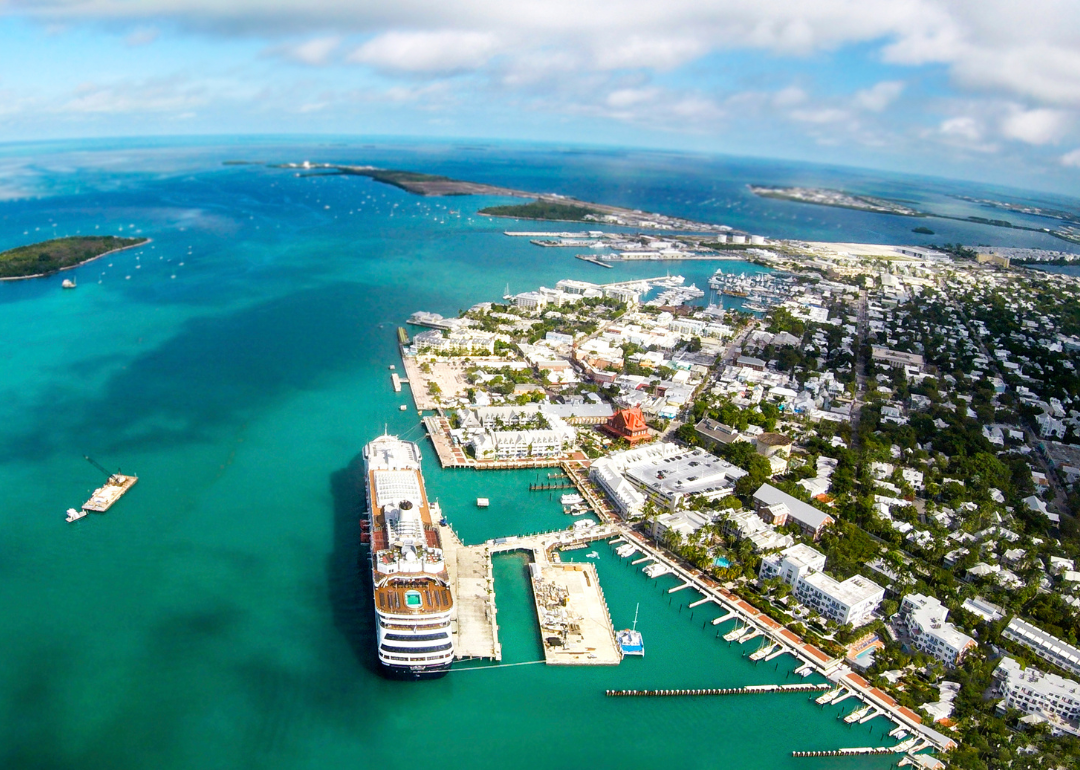
#18. Key West, FL metro area
– Average sale to list ratio: 0.949
– Total homes sold: 22
– Median sale price: $805,000
Michael J. Kearney // Wikimedia Commons
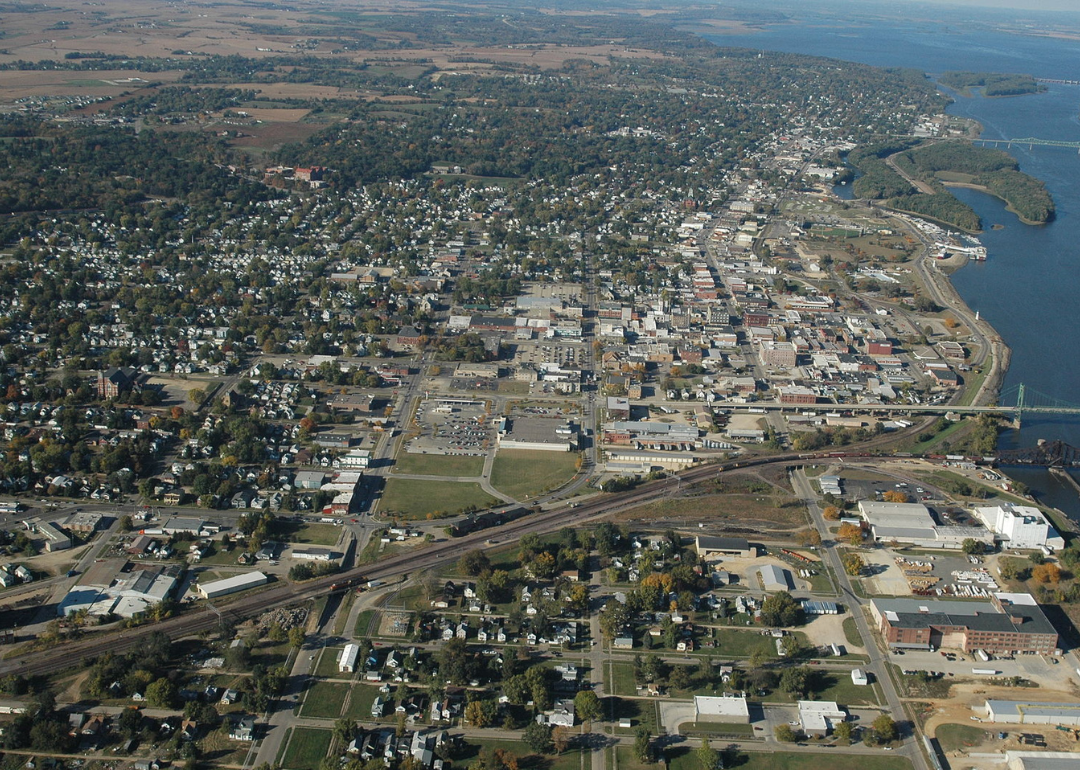
#17. Clinton, IA metro area
– Average sale to list ratio: 0.948
– Total homes sold: 17
– Median sale price: $147,500

Roberto Galan // Shutterstock
#16. Paragould, AR metro area
– Average sale to list ratio: 0.948
– Total homes sold: 14
– Median sale price: $161,500
You may also like: The richest town in every state
IvoShandor // Wikimedia Commons
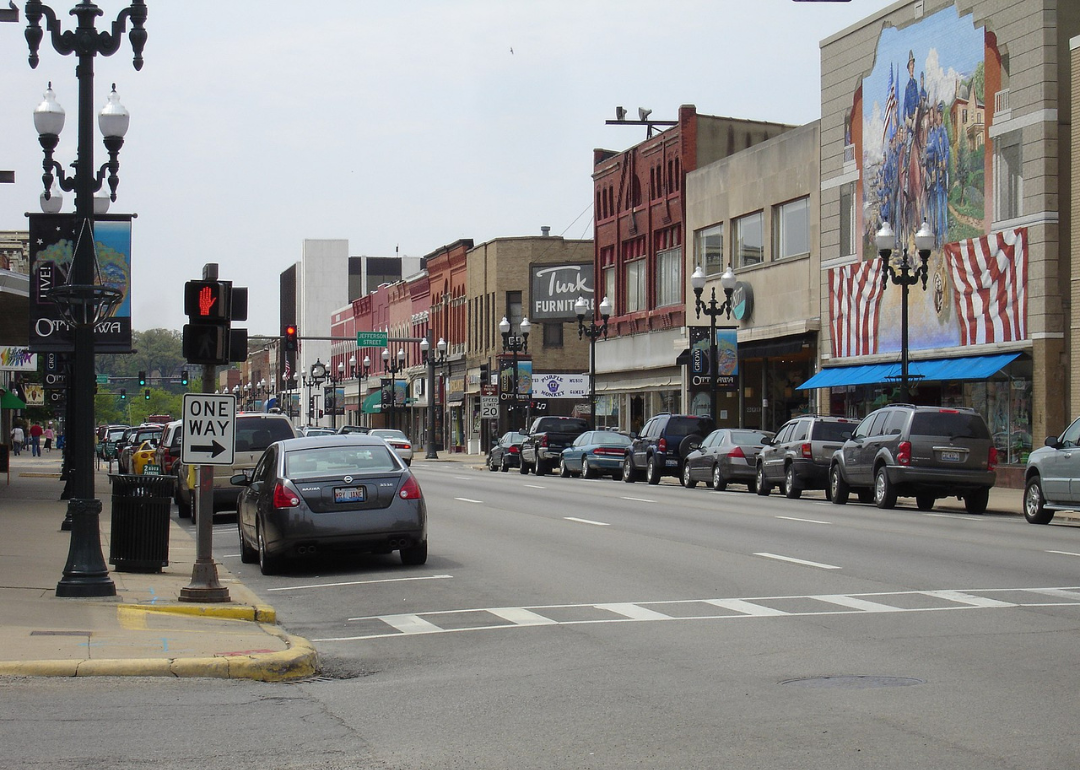
#15. Ottawa, IL metro area
– Average sale to list ratio: 0.947
– Total homes sold: 27
– Median sale price: $117,000
Roberto Galan // Shutterstock
#14. Poplar Bluff, MO metro area
– Average sale to list ratio: 0.947
– Total homes sold: 13
– Median sale price: $180,000

Jacob Boomsma // Shutterstock
#13. Fergus Falls, MN metro area
– Average sale to list ratio: 0.947
– Total homes sold: 18
– Median sale price: $257,500

Public Domain
#12. Las Cruces, NM metro area
– Average sale to list ratio: 0.946
– Total homes sold: 38
– Median sale price: $315,000

Alvin Feng // Wikimedia Commons
#11. Sandpoint, ID metro area
– Average sale to list ratio: 0.944
– Total homes sold: 17
– Median sale price: $580,000
You may also like: Best places to live in the Midwest
Nolichuckyjake // Shutterstock
#10. Shelby, NC metro area
– Average sale to list ratio: 0.940
– Total homes sold: 13
– Median sale price: $220,000
Canva
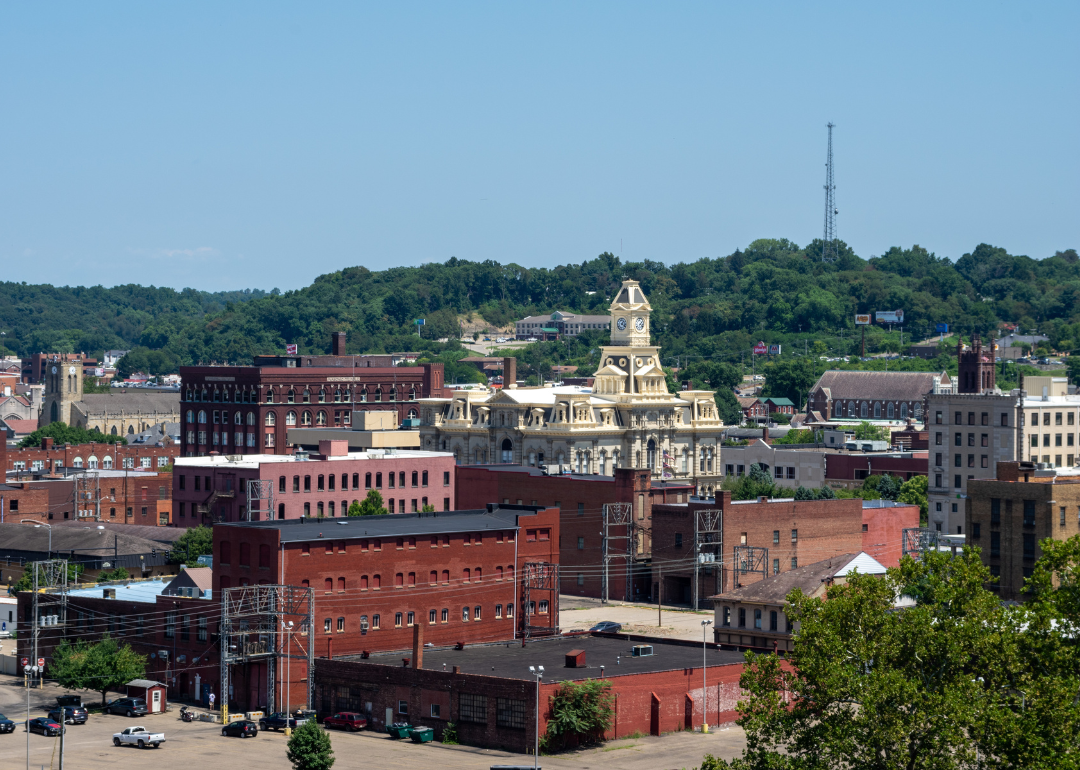
#9. Zanesville, OH metro area
– Average sale to list ratio: 0.937
– Total homes sold: 15
– Median sale price: $140,000

Prestinian // Wikimedia Commons
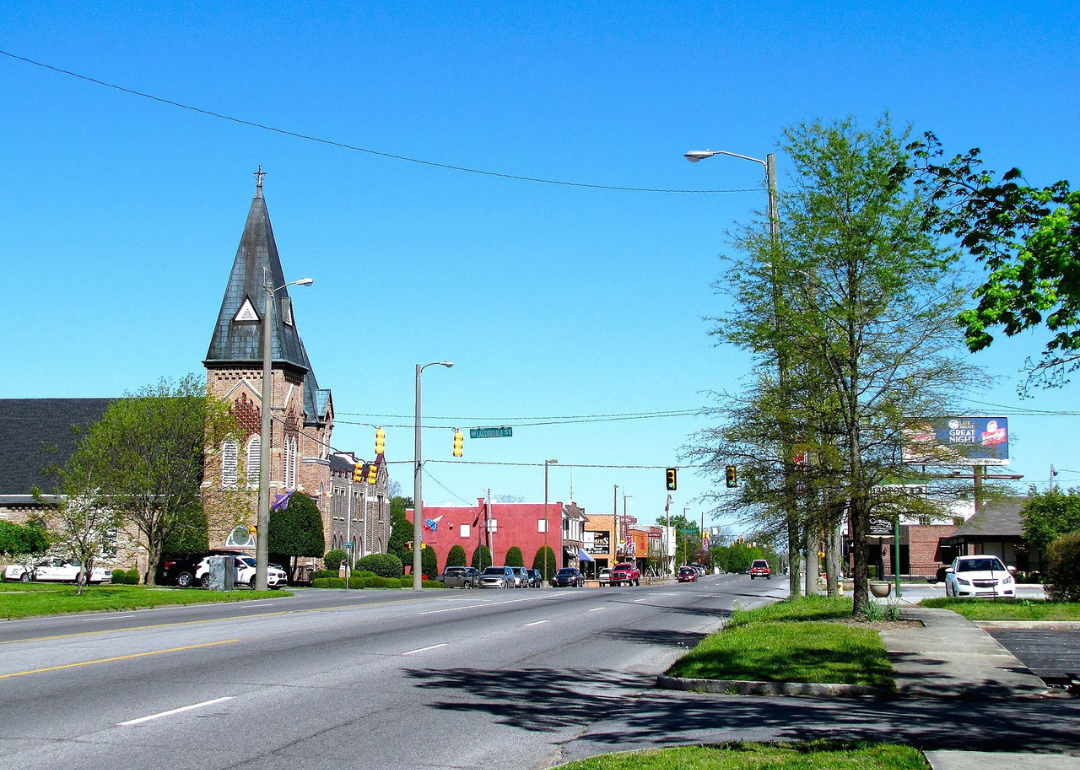
#8. Gadsden, AL metro area
– Average sale to list ratio: 0.935
– Total homes sold: 19
– Median sale price: $205,000
Derek Jensen (Tysto) // Wikimedia Commons
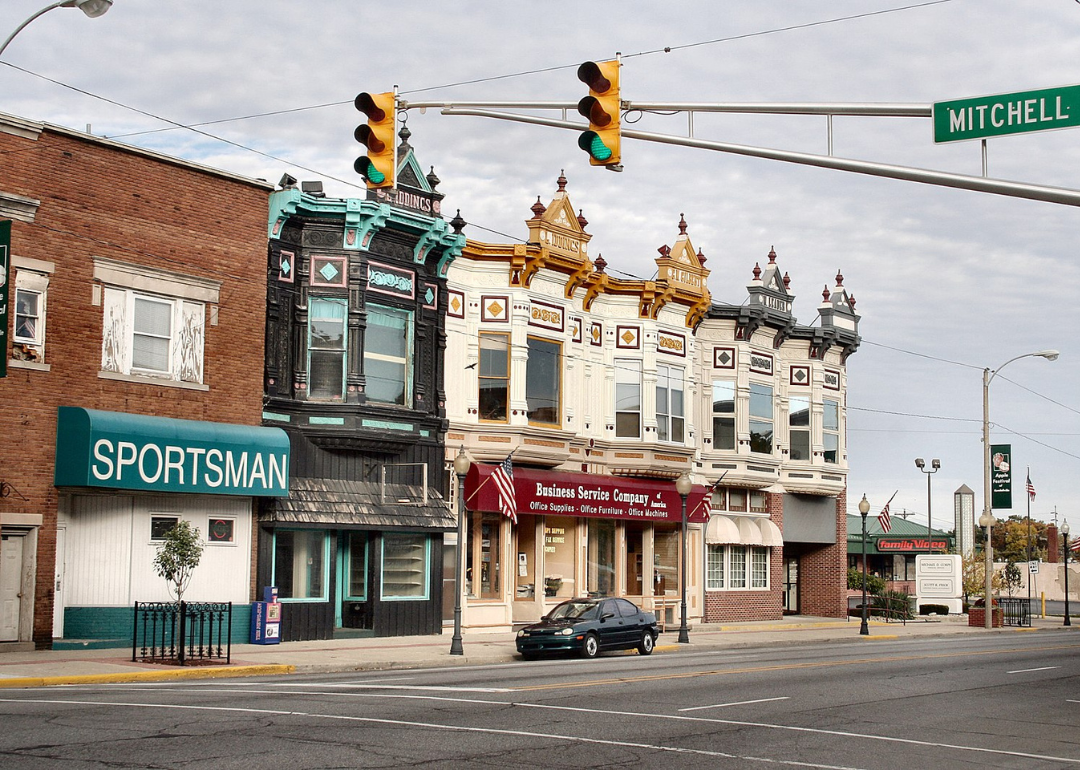
#7. Kendallville, IN metro area
– Average sale to list ratio: 0.934
– Total homes sold: 14
– Median sale price: $262,000
Tc65306n // Wikimedia Commons
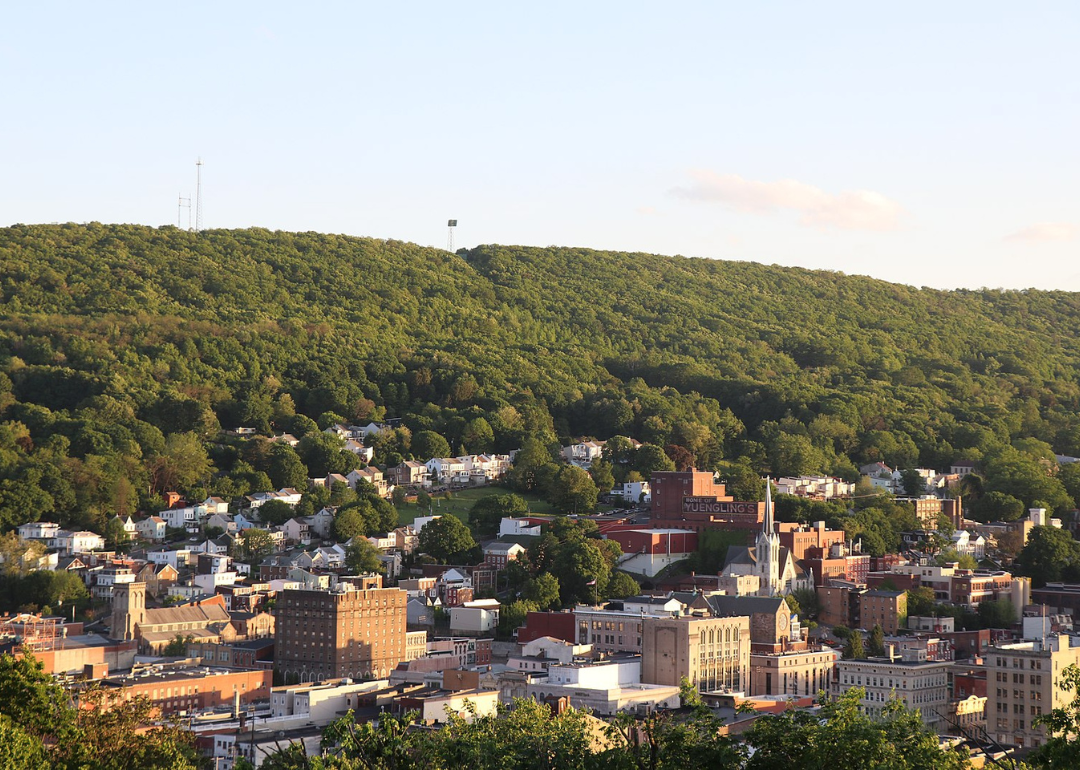
#6. Pottsville, PA metro area
– Average sale to list ratio: 0.930
– Total homes sold: 35
– Median sale price: $101,100
You may also like: Iconic buildings from every state
Jacob Boomsma // Shutterstock
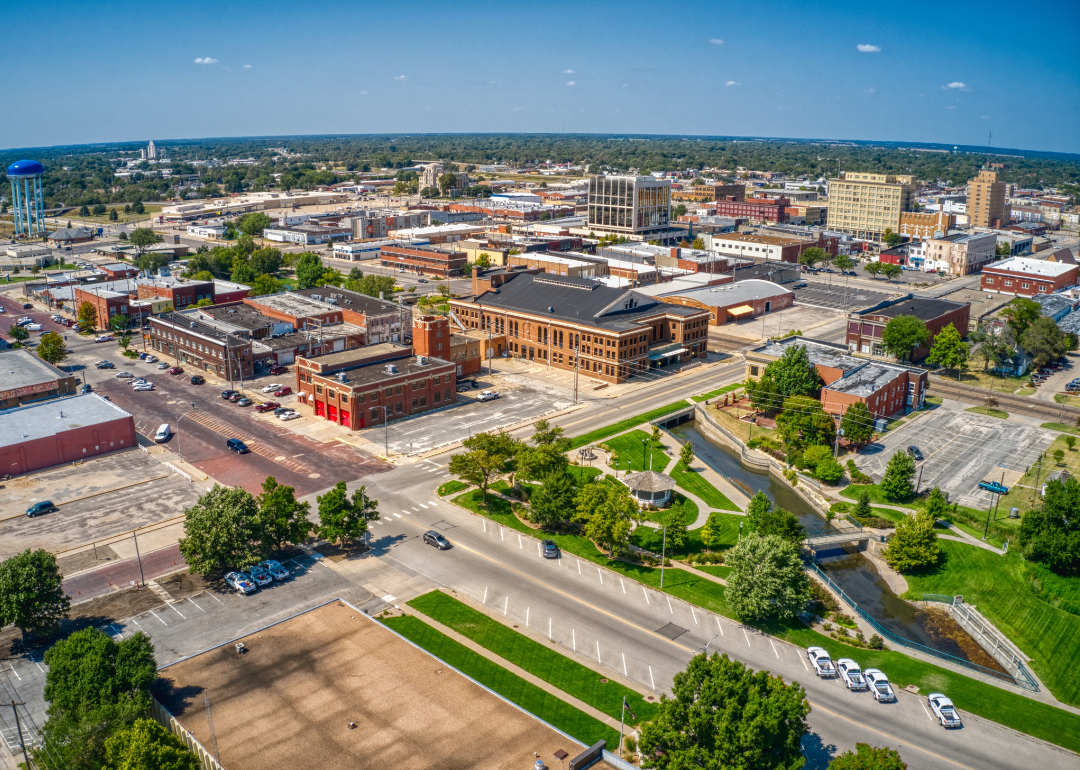
#5. Hutchinson, KS metro area
– Average sale to list ratio: 0.926
– Total homes sold: 16
– Median sale price: $154,900

Patrick Feller//Flickr
#4. Lake Charles, LA metro area
– Average sale to list ratio: 0.922
– Total homes sold: 32
– Median sale price: $215,500
Jumping Rocks // Getty Images
#3. Ardmore, OK metro area
– Average sale to list ratio: 0.922
– Total homes sold: 26
– Median sale price: $136,000

Thomson200 // Wikimedia Commons
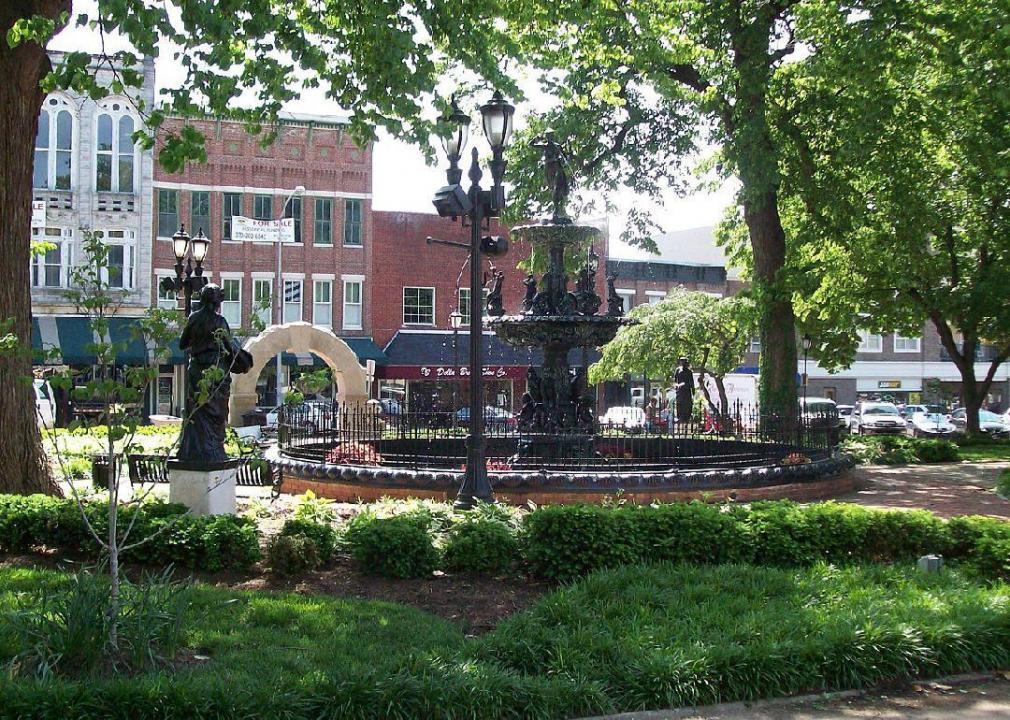
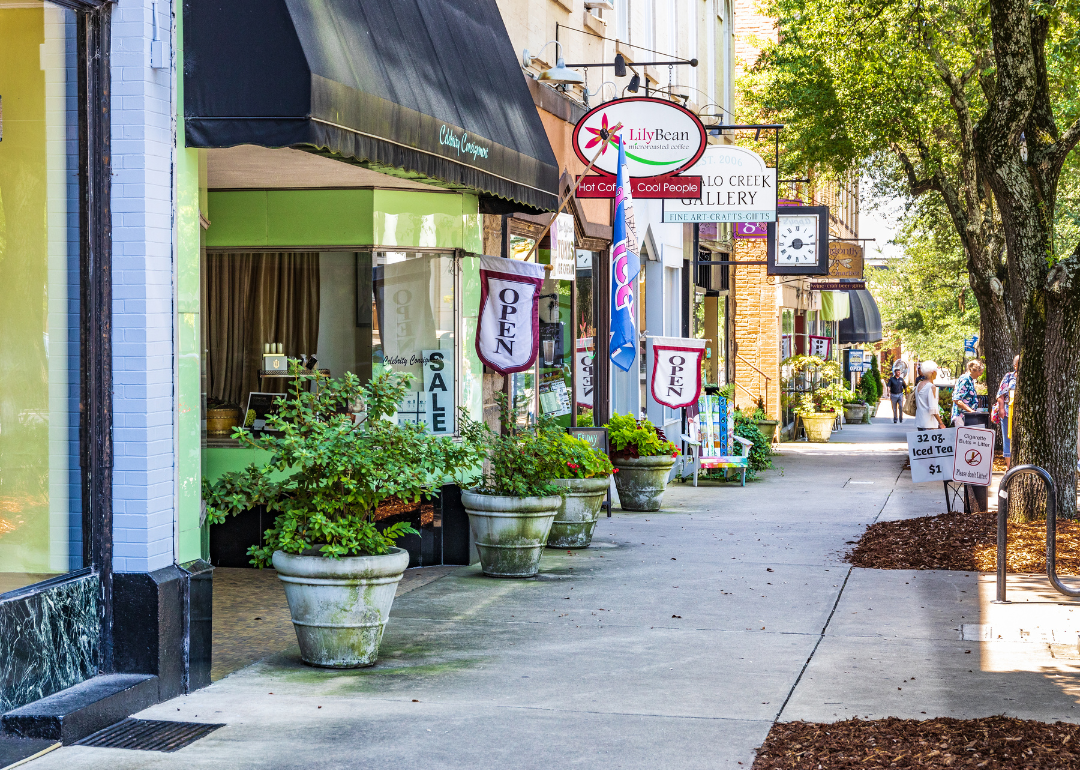
#2. Rome, GA metro area
– Average sale to list ratio: 0.916
– Total homes sold: 19
– Median sale price: $170,000
ROBERT SBARRA // Shutterstock
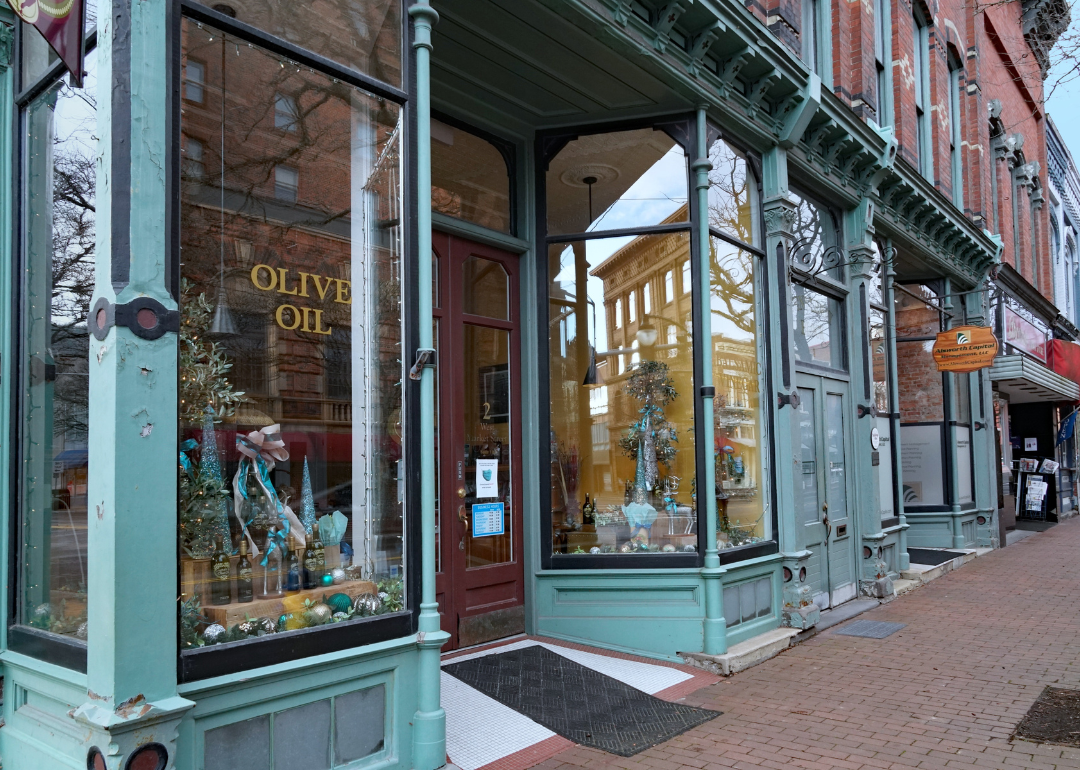
#1. New Castle, PA metro area
– Average sale to list ratio: 0.898
– Total homes sold: 27
– Median sale price: $140,000
You may also like: These are best cities to raise a family in