Where people in Phoenix are moving to most

DPPed// Wikimedia
Where people in Phoenix are moving to most
Stacker compiled a list of where people in Phoenix-Mesa-Chandler, AZ Metro Area are moving to the most using data from the U.S. Census Bureau. Metros are ranked by the estimated number of people who moved to the metro from Phoenix between 2015 and 2019. Ties were broken by gross migration.
You may also like: Cities with the most expensive homes in Phoenix metro area
![]()

Sharkshock // Shutterstock
#50. Raleigh-Cary, NC Metro Area
– Migration to Raleigh in 2015-2019: 504
– Migration from Raleigh to Phoenix: 422 (#29 most common destination from Raleigh)
– Net migration: 82 to Raleigh
Scott Catron // Wikimedia Commons
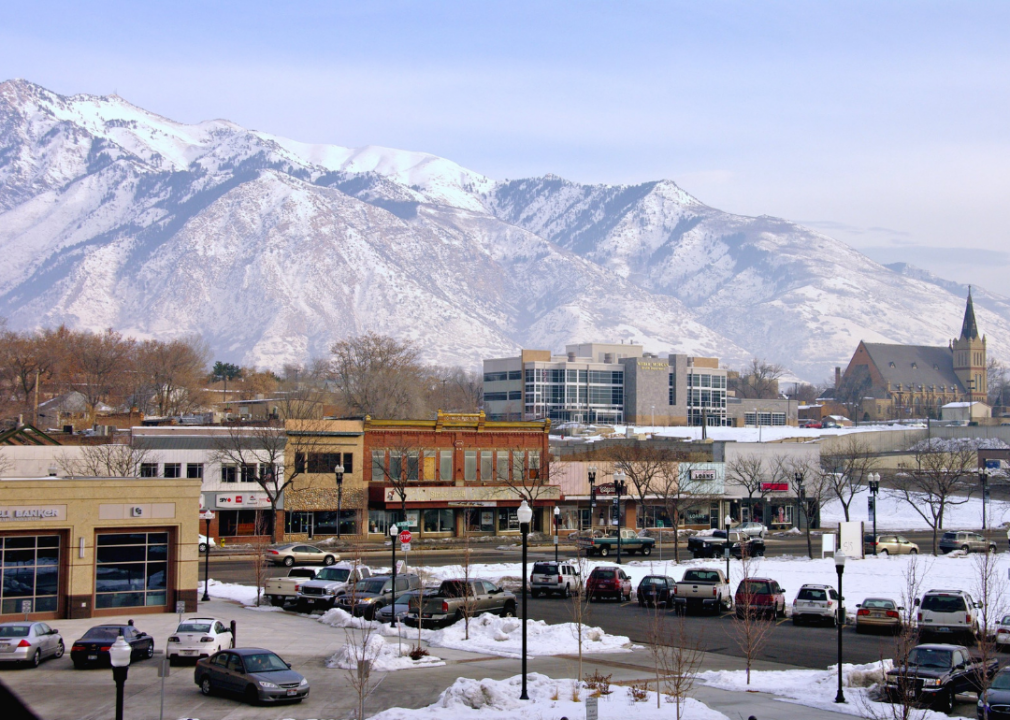
#49. Ogden-Clearfield, UT Metro Area
– Migration to Ogden in 2015-2019: 508
– Migration from Ogden to Phoenix: 1,516 (#4 most common destination from Ogden)
– Net migration: 1,008 to Phoenix

Max Pixel
#48. Milwaukee-Waukesha, WI Metro Area
– Migration to Milwaukee in 2015-2019: 519
– Migration from Milwaukee to Phoenix: 1,773 (#5 most common destination from Milwaukee)
– Net migration: 1,254 to Phoenix

Sean Pavone // Shutterstock
#47. St. Louis, MO-IL Metro Area
– Migration to St. Louis in 2015-2019: 550
– Migration from St. Louis to Phoenix: 1,625 (#7 most common destination from St. Louis)
– Net migration: 1,075 to Phoenix

Edmund Garman // Flickr
#46. Urban Honolulu, HI Metro Area
– Migration to Urban Honolulu in 2015-2019: 559
– Migration from Urban Honolulu to Phoenix: 1,326 (#8 most common destination from Urban Honolulu)
– Net migration: 767 to Phoenix
You may also like: Most common jobs in Phoenix
Public Domain
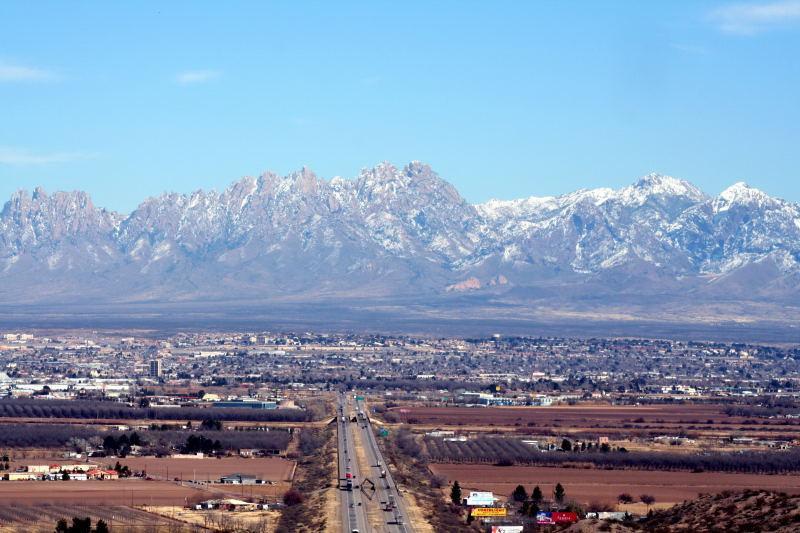
#45. Las Cruces, NM Metro Area
– Migration to Las Cruces in 2015-2019: 594
– Migration from Las Cruces to Phoenix: 482 (#3 most common destination from Las Cruces)
– Net migration: 112 to Las Cruces

f11photo // Shutterstock
#44. Nashville-Davidson–Murfreesboro–Franklin, TN Metro Area
– Migration to Nashville in 2015-2019: 602
– Migration from Nashville to Phoenix: 530 (#24 most common destination from Nashville)
– Net migration: 72 to Nashville

Wangkun Jia // Shutterstock
#43. Albany-Schenectady-Troy, NY Metro Area
– Migration to Albany in 2015-2019: 607
– Migration from Albany to Phoenix: 120 (#61 most common destination from Albany)
– Net migration: 487 to Albany

Kolossos // Wikimedia Commons
#42. Miami-Fort Lauderdale-Pompano Beach, FL Metro Area
– Migration to Miami in 2015-2019: 618
– Migration from Miami to Phoenix: 739 (#43 most common destination from Miami)
– Net migration: 121 to Phoenix

Alvesgaspar // Wikimedia
#41. Tampa-St. Petersburg-Clearwater, FL Metro Area
– Migration to Tampa in 2015-2019: 677
– Migration from Tampa to Phoenix: 711 (#30 most common destination from Tampa)
– Net migration: 34 to Phoenix
You may also like: Highest-rated restaurants in Phoenix, according to Tripadvisor

Boise Metro Chamber // Flickr
#40. Boise City, ID Metro Area
– Migration to Boise City in 2015-2019: 684
– Migration from Boise City to Phoenix: 509 (#7 most common destination from Boise City)
– Net migration: 175 to Boise City

Sean Pavone // Shutterstock
#39. Boston-Cambridge-Newton, MA-NH Metro Area
– Migration to Boston in 2015-2019: 729
– Migration from Boston to Phoenix: 1,130 (#28 most common destination from Boston)
– Net migration: 401 to Phoenix
Ron Reiring // Wikicommons
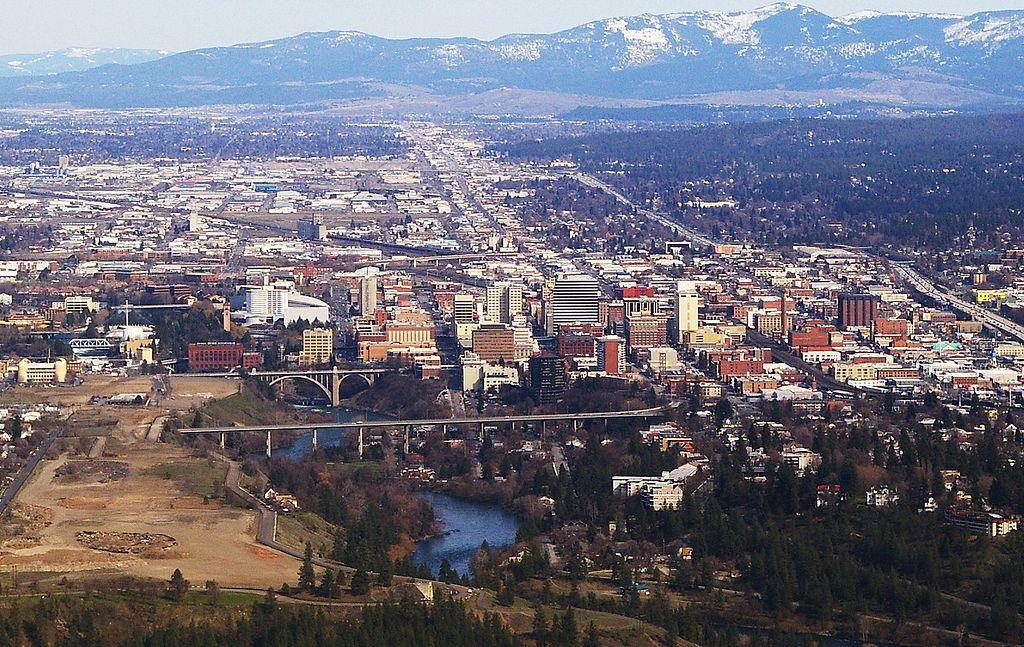
#38. Spokane-Spokane Valley, WA Metro Area
– Migration to Spokane in 2015-2019: 730
– Migration from Spokane to Phoenix: 1,035 (#2 most common destination from Spokane)
– Net migration: 305 to Phoenix

f11photo // Shutterstock
#37. Philadelphia-Camden-Wilmington, PA-NJ-DE-MD Metro Area
– Migration to Philadelphia in 2015-2019: 732
– Migration from Philadelphia to Phoenix: 1,679 (#26 most common destination from Philadelphia)
– Net migration: 947 to Phoenix
davidwilson1949 // Flickr
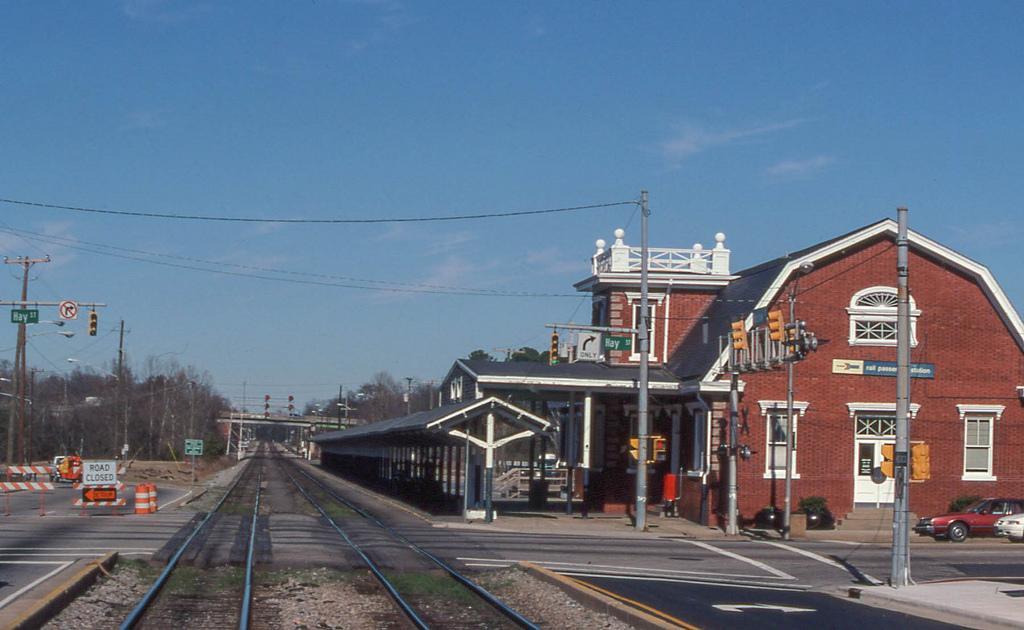
#36. Fayetteville, NC Metro Area
– Migration to Fayetteville in 2015-2019: 737
– Migration from Fayetteville to Phoenix: 585 (#17 most common destination from Fayetteville)
– Net migration: 152 to Fayetteville
You may also like: Biggest sources of immigrants to Phoenix

Wikimedia
#35. Oklahoma City, OK Metro Area
– Migration to Oklahoma City in 2015-2019: 738
– Migration from Oklahoma City to Phoenix: 1,169 (#5 most common destination from Oklahoma City)
– Net migration: 431 to Phoenix

nickchapman // Wikicommons
#34. Bakersfield, CA Metro Area
– Migration to Bakersfield in 2015-2019: 798
– Migration from Bakersfield to Phoenix: 996 (#6 most common destination from Bakersfield)
– Net migration: 198 to Phoenix

BusinessEditorUSA // Wikimedia Commons
#33. Charlotte-Concord-Gastonia, NC-SC Metro Area
– Migration to Charlotte in 2015-2019: 860
– Migration from Charlotte to Phoenix: 534 (#35 most common destination from Charlotte)
– Net migration: 326 to Charlotte

M.Bucka // Wikimedia Commons
#32. Albuquerque, NM Metro Area
– Migration to Albuquerque in 2015-2019: 880
– Migration from Albuquerque to Phoenix: 2,124 (#2 most common destination from Albuquerque)
– Net migration: 1,244 to Phoenix

Epccedu // Wikimedia Commons
#31. El Paso, TX Metro Area
– Migration to El Paso in 2015-2019: 890
– Migration from El Paso to Phoenix: 858 (#8 most common destination from El Paso)
– Net migration: 32 to El Paso
You may also like: Highest-paying jobs in Phoenix

Robert Corby // Wikimedia Commons
#30. Colorado Springs, CO Metro Area
– Migration to Colorado Springs in 2015-2019: 894
– Migration from Colorado Springs to Phoenix: 1,002 (#9 most common destination from Colorado Springs)
– Net migration: 108 to Phoenix

PhotosByMahin // Pixabay
#29. Detroit-Warren-Dearborn, MI Metro Area
– Migration to Detroit in 2015-2019: 1,043
– Migration from Detroit to Phoenix: 1,799 (#9 most common destination from Detroit)
– Net migration: 756 to Phoenix

Keizers // Wikimedia Commons
#28. Atlanta-Sandy Springs-Alpharetta, GA Metro Area
– Migration to Atlanta in 2015-2019: 1,099
– Migration from Atlanta to Phoenix: 1,835 (#21 most common destination from Atlanta)
– Net migration: 736 to Phoenix

Pixabay
#27. Sacramento-Roseville-Folsom, CA Metro Area
– Migration to Sacramento in 2015-2019: 1,105
– Migration from Sacramento to Phoenix: 1,793 (#11 most common destination from Sacramento)
– Net migration: 688 to Phoenix

Don Ramey Logan // Wikicommons
#26. San Jose-Sunnyvale-Santa Clara, CA Metro Area
– Migration to San Jose in 2015-2019: 1,162
– Migration from San Jose to Phoenix: 1,538 (#17 most common destination from San Jose)
– Net migration: 376 to Phoenix
You may also like: Highest-rated Mexican restaurants in Phoenix, according to Tripadvisor

Skyguy414 // Wikicommons
#25. Salt Lake City, UT Metro Area
– Migration to Salt Lake City in 2015-2019: 1,169
– Migration from Salt Lake City to Phoenix: 2,218 (#3 most common destination from Salt Lake City)
– Net migration: 1,049 to Phoenix

TommyBrison // Shutterstock
#24. Kansas City, MO-KS Metro Area
– Migration to Kansas City in 2015-2019: 1,192
– Migration from Kansas City to Phoenix: 1,342 (#9 most common destination from Kansas City)
– Net migration: 150 to Phoenix

Pixabay
#23. Austin-Round Rock-Georgetown, TX Metro Area
– Migration to Austin in 2015-2019: 1,325
– Migration from Austin to Phoenix: 1,732 (#6 most common destination from Austin)
– Net migration: 407 to Phoenix

Tony Webster // Wikicommons
#22. Minneapolis-St. Paul-Bloomington, MN-WI Metro Area
– Migration to Minneapolis in 2015-2019: 1,463
– Migration from Minneapolis to Phoenix: 3,500 (#3 most common destination from Minneapolis)
– Net migration: 2,037 to Phoenix

Andrew Bossi // Wikimedia
#21. Washington-Arlington-Alexandria, DC-VA-MD-WV Metro Area
– Migration to Washington in 2015-2019: 1,549
– Migration from Washington to Phoenix: 1,980 (#30 most common destination from Washington)
– Net migration: 431 to Phoenix
You may also like: People from these metros are finding new jobs in Phoenix
Ken L. // Flickr
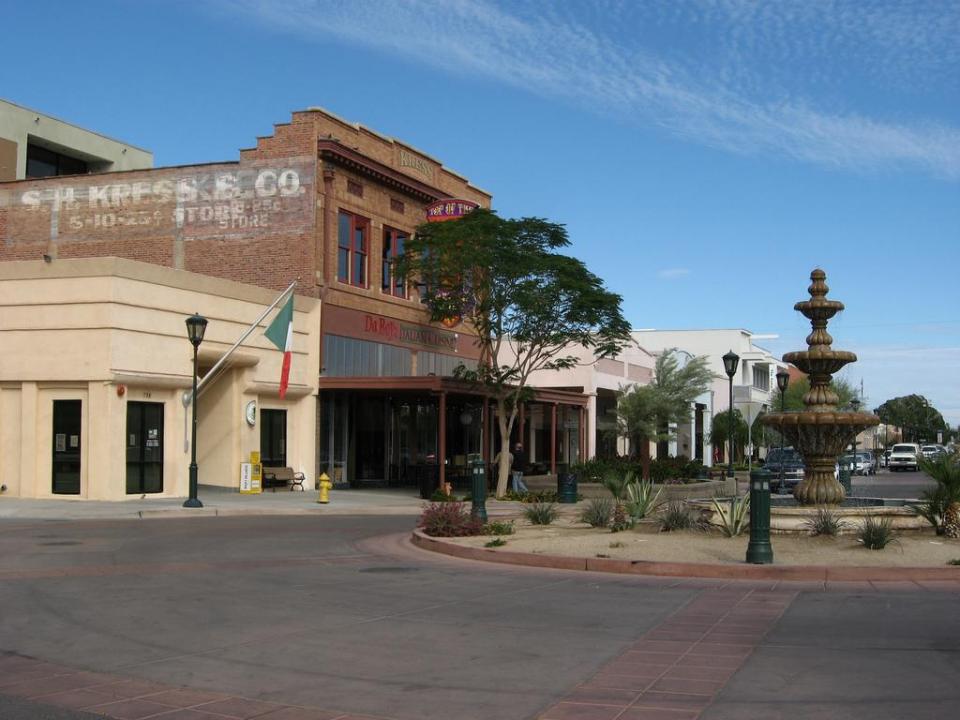
#20. Yuma, AZ Metro Area
– Migration to Yuma in 2015-2019: 1,634
– Migration from Yuma to Phoenix: 2,095 (#1 most common destination from Yuma)
– Net migration: 461 to Phoenix

King of Hearts // Wikimedia
#19. New York-Newark-Jersey City, NY-NJ-PA Metro Area
– Migration to New York in 2015-2019: 1,692
– Migration from New York to Phoenix: 4,287 (#26 most common destination from New York)
– Net migration: 2,595 to Phoenix

en:User:Paul.h // Wikimedia
#18. San Francisco-Oakland-Berkeley, CA Metro Area
– Migration to San Francisco in 2015-2019: 1,731
– Migration from San Francisco to Phoenix: 3,031 (#15 most common destination from San Francisco)
– Net migration: 1,300 to Phoenix

Pixabay
#17. San Antonio-New Braunfels, TX Metro Area
– Migration to San Antonio in 2015-2019: 1,793
– Migration from San Antonio to Phoenix: 899 (#13 most common destination from San Antonio)
– Net migration: 894 to San Antonio

skeeze // Pixabay
#16. Houston-The Woodlands-Sugar Land, TX Metro Area
– Migration to Houston in 2015-2019: 1,926
– Migration from Houston to Phoenix: 1,255 (#22 most common destination from Houston)
– Net migration: 671 to Houston
You may also like: Highest-rated steakhouses in Phoenix, according to Tripadvisor

Ben P L // Wikimedia Commons
#15. Provo-Orem, UT Metro Area
– Migration to Provo in 2015-2019: 1,979
– Migration from Provo to Phoenix: 1,198 (#4 most common destination from Provo)
– Net migration: 781 to Provo

InSapphoWeTrust // Wikicommons
#14. Lake Havasu City-Kingman, AZ Metro Area
– Migration to Lake Havasu City in 2015-2019: 2,197
– Migration from Lake Havasu City to Phoenix: 2,192 (#1 most common destination from Lake Havasu City)
– Net migration: 5 to Lake Havasu City

GeorgeNeedham // Flickr
#13. Sierra Vista-Douglas, AZ Metro Area
– Migration to Sierra Vista in 2015-2019: 2,284
– Migration from Sierra Vista to Phoenix: 1,607 (#2 most common destination from Sierra Vista)
– Net migration: 677 to Sierra Vista

Christopher & Amy Esposito // Wikicommons
#12. Chicago-Naperville-Elgin, IL-IN-WI Metro Area
– Migration to Chicago in 2015-2019: 2,593
– Migration from Chicago to Phoenix: 7,859 (#2 most common destination from Chicago)
– Net migration: 5,266 to Phoenix

SD Dirk // Flickr
#11. San Diego-Chula Vista-Carlsbad, CA Metro Area
– Migration to San Diego in 2015-2019: 2,740
– Migration from San Diego to Phoenix: 5,493 (#4 most common destination from San Diego)
– Net migration: 2,753 to Phoenix
You may also like: Lowest-paying jobs in Phoenix

f11photo // Shutterstock
#10. Denver-Aurora-Lakewood, CO Metro Area
– Migration to Denver in 2015-2019: 2,890
– Migration from Denver to Phoenix: 4,052 (#5 most common destination from Denver)
– Net migration: 1,162 to Phoenix

Stuart Seeger // Wikicommons
#9. Portland-Vancouver-Hillsboro, OR-WA Metro Area
– Migration to Portland in 2015-2019: 2,939
– Migration from Portland to Phoenix: 4,643 (#3 most common destination from Portland)
– Net migration: 1,704 to Phoenix

randy andy // Shutterstock
#8. Las Vegas-Henderson-Paradise, NV Metro Area
– Migration to Las Vegas in 2015-2019: 2,990
– Migration from Las Vegas to Phoenix: 2,895 (#3 most common destination from Las Vegas)
– Net migration: 95 to Las Vegas

Daniel Orth // Flickr
#7. Riverside-San Bernardino-Ontario, CA Metro Area
– Migration to Riverside in 2015-2019: 3,448
– Migration from Riverside to Phoenix: 4,947 (#3 most common destination from Riverside)
– Net migration: 1,499 to Phoenix

Alan Botting // Wikimedia Commons
#6. Dallas-Fort Worth-Arlington, TX Metro Area
– Migration to Dallas in 2015-2019: 3,715
– Migration from Dallas to Phoenix: 2,272 (#19 most common destination from Dallas)
– Net migration: 1,443 to Dallas
You may also like: Zip codes with the most expensive homes in Phoenix metro area
Public Domain
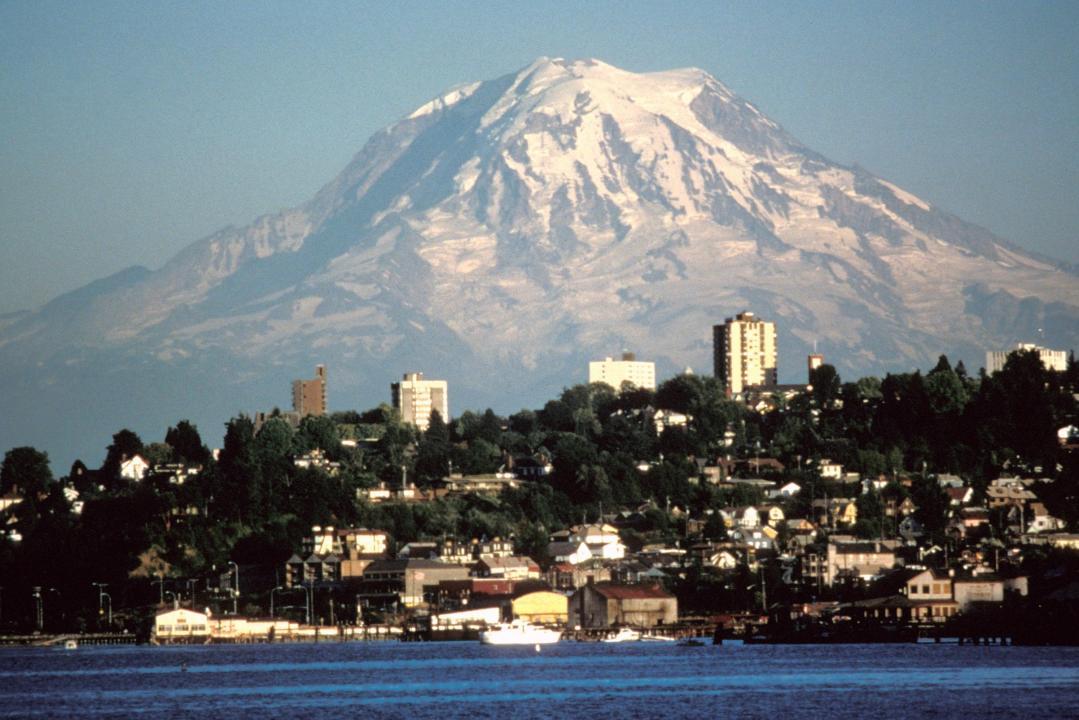
#5. Seattle-Tacoma-Bellevue, WA Metro Area
– Migration to Seattle in 2015-2019: 4,868
– Migration from Seattle to Phoenix: 5,569 (#6 most common destination from Seattle)
– Net migration: 701 to Phoenix

BDS2006 // Wikimedia
#4. Los Angeles-Long Beach-Anaheim, CA Metro Area
– Migration to Los Angeles in 2015-2019: 4,904
– Migration from Los Angeles to Phoenix: 13,273 (#5 most common destination from Los Angeles)
– Net migration: 8,369 to Phoenix

Martha.baden // Wikimedia
#3. Prescott Valley-Prescott, AZ Metro Area
– Migration to Prescott Valley in 2015-2019: 5,163
– Migration from Prescott Valley to Phoenix: 3,299 (#1 most common destination from Prescott Valley)
– Net migration: 1,864 to Prescott Valley

Derek.cashman // Wikicommons
#2. Flagstaff, AZ Metro Area
– Migration to Flagstaff in 2015-2019: 6,451
– Migration from Flagstaff to Phoenix: 4,791 (#1 most common destination from Flagstaff)
– Net migration: 1,660 to Flagstaff

Zereshk // Wikimedia
#1. Tucson, AZ Metro Area
– Migration to Tucson in 2015-2019: 11,191
– Migration from Tucson to Phoenix: 11,601 (#1 most common destination from Tucson)
– Net migration: 410 to Phoenix
You may also like: Highest-rated Italian restaurants in Phoenix, according to Tripadvisor