Metros where homes are selling for the most over asking price

Paul Brady Photography // Shutterstock
Metros where homes are selling for the most over asking price
The Federal Reserve’s efforts to curb inflation have pushed interest rates to levels unseen in more than two decades, and the number of homes selling each month has been on the decline for eight straight months now.
But homes are still selling, even if slowly. And they’re still increasing in price, even if that increase has been slowed just a bit too. In fact, some are still selling for slightly more than the list price. Because of the market change, only 30 metros have homes that are selling at or over asking.
Stacker analyzed data from Redfin to see which metros had the most homes sold over asking price. Data shows sales for the week ending Dec. 25, 2022. Metros where fewer than 15 homes were sold were excluded from this list, and the metros are ranked based on the average sale-to-list ratio. This is a mean ratio of the home sale price divided by the list price.
You may also like: Oldest cities in America
![]()

Canva
#30. Monroe, LA metro area
– Average sale to list ratio: 1.0
– Total homes sold: 22
– Median sale price: $194,700

Canva
#29. Wilmington, DE metro area
– Average sale to list ratio: 1.0
– Total homes sold: 110
– Median sale price: $310,000

Tradewinds // Wikimedia Commons
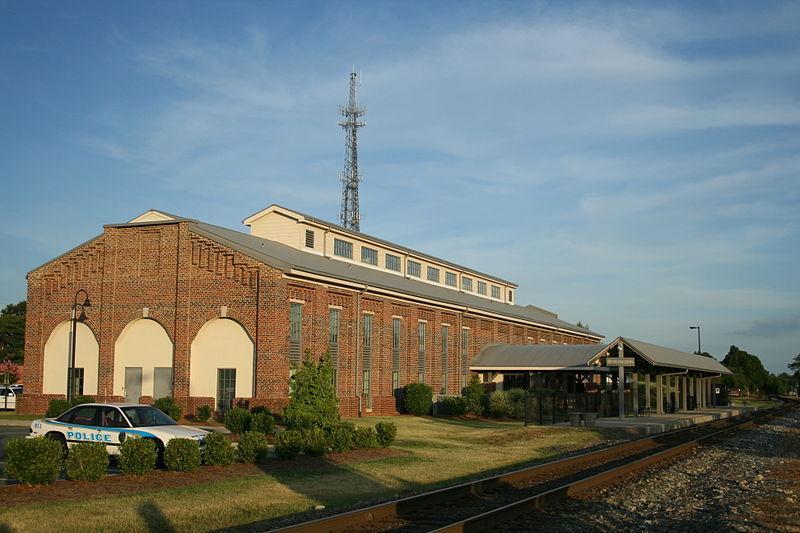
#28. New Bern, NC metro area
– Average sale to list ratio: 1.0
– Total homes sold: 28
– Median sale price: $265,500

tochichi//Wikicommons
#27. Rapid City, SD metro area
– Average sale to list ratio: 1.0
– Total homes sold: 19
– Median sale price: $325,000
Ildar Sagdejev // Wikimedia
#26. Burlington, NC metro area
– Average sale to list ratio: 1.001
– Total homes sold: 30
– Median sale price: $242,750

spablab // Flickr
#25. Providence, RI metro area
– Average sale to list ratio: 1.001
– Total homes sold: 266
– Median sale price: $407,500

Teemu008 /// Flickr
#24. Bloomington, IL metro area
– Average sale to list ratio: 1.001
– Total homes sold: 33
– Median sale price: $165,000

Library of Congress
#23. Auburn, AL metro area
– Average sale to list ratio: 1.002
– Total homes sold: 25
– Median sale price: $320,000

Bruce Emmerling // Wikicommons
#22. Baltimore, MD metro area
– Average sale to list ratio: 1.002
– Total homes sold: 495
– Median sale price: $335,000

Bobak Ha’Eri // Wikimedia Commons
#21. Wausau, WI metro area
– Average sale to list ratio: 1.004
– Total homes sold: 16
– Median sale price: $239,500

Albert Pego // Shutterstock
#20. Burlington, VT metro area
– Average sale to list ratio: 1.006
– Total homes sold: 40
– Median sale price: $366,000

Canva
#19. Newark, NJ metro area
– Average sale to list ratio: 1.006
– Total homes sold: 352
– Median sale price: $440,500
Doug Kerr // Wikimedia Commons
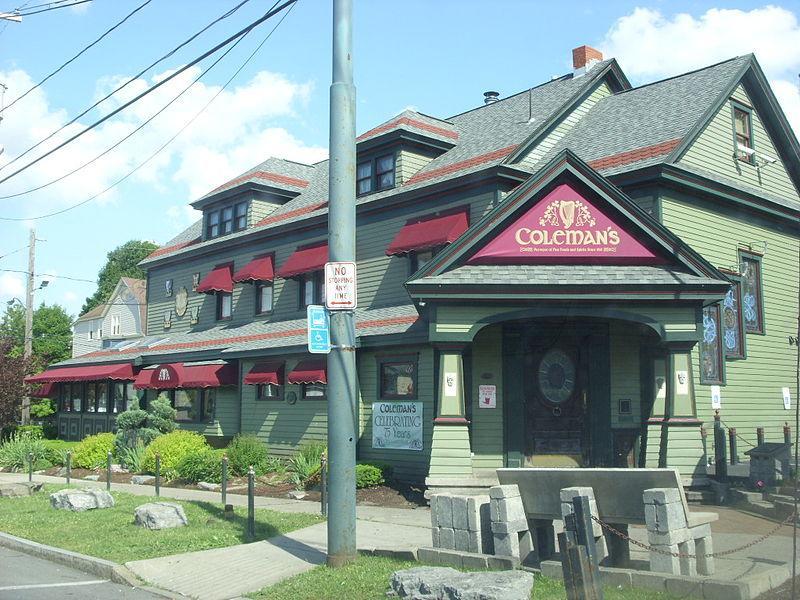
#18. Syracuse, NY metro area
– Average sale to list ratio: 1.007
– Total homes sold: 93
– Median sale price: $185,000

Wangkun Jia // Shutterstock
#17. Albany, NY metro area
– Average sale to list ratio: 1.007
– Total homes sold: 122
– Median sale price: $297,500

Bill Golladay // Wikipedia Commons
#16. Warner Robins, GA metro area
– Average sale to list ratio: 1.008
– Total homes sold: 49
– Median sale price: $260,000

Wtoc11 // Flickr
#15. Hinesville, GA metro area
– Average sale to list ratio: 1.009
– Total homes sold: 24
– Median sale price: $265,825

Canva
#14. Concord, NH metro area
– Average sale to list ratio: 1.009
– Total homes sold: 35
– Median sale price: $355,000
Visit Beloit // Wikimedia Commons
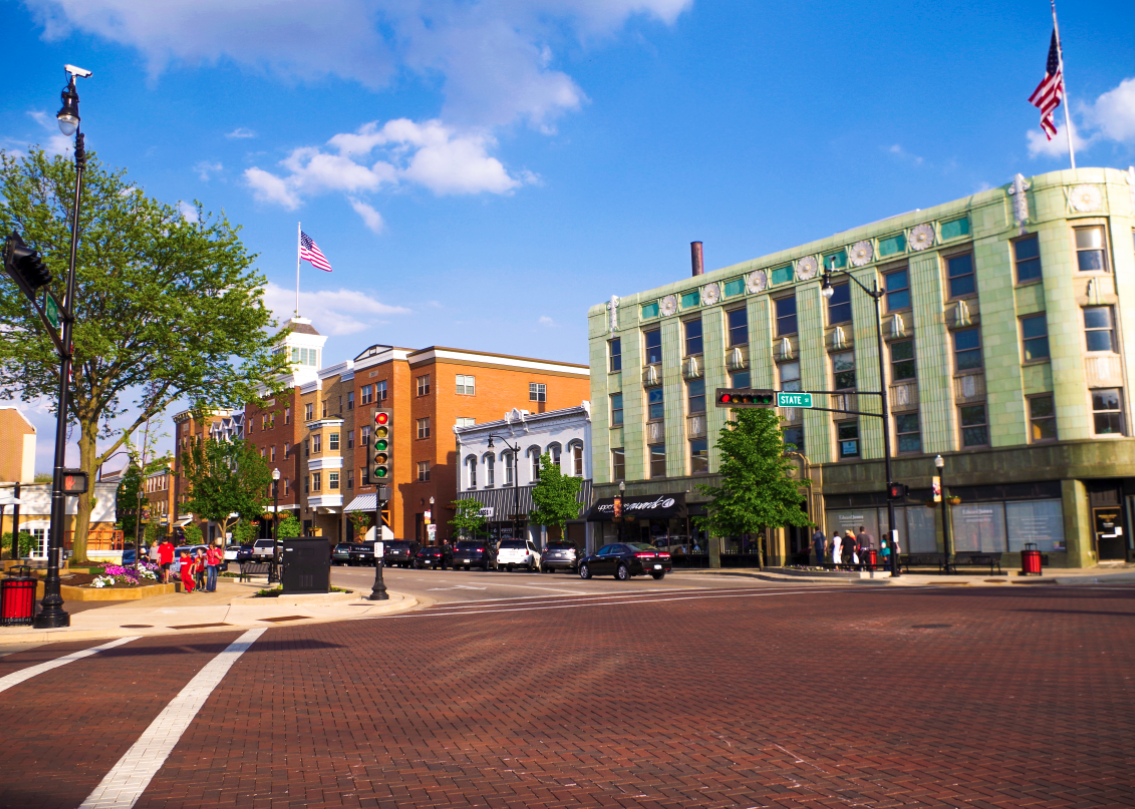
#13. Janesville, WI metro area
– Average sale to list ratio: 1.010
– Total homes sold: 29
– Median sale price: $197,500

John Phelan // Wikimedia
#12. Hartford, CT metro area
– Average sale to list ratio: 1.010
– Total homes sold: 209
– Median sale price: $290,000
John Phelan // Wikimedia Commons
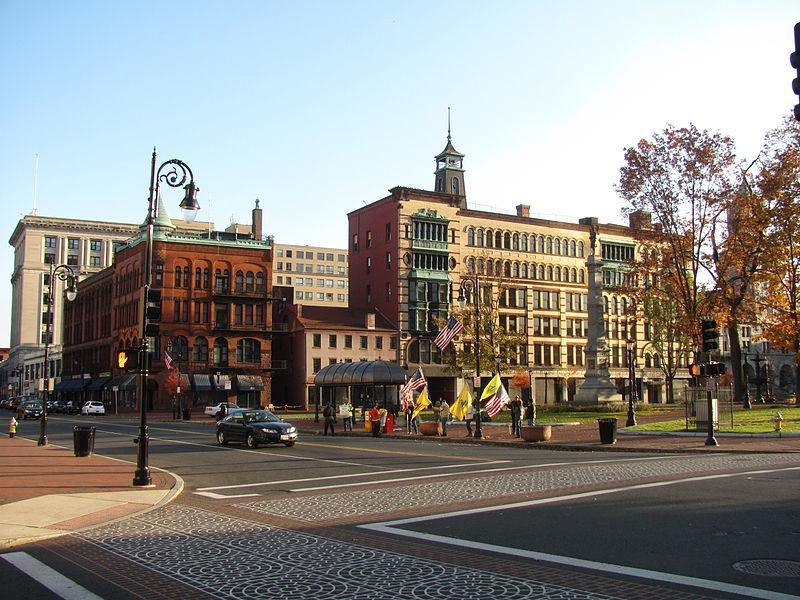
#11. Springfield, MA metro area
– Average sale to list ratio: 1.012
– Total homes sold: 107
– Median sale price: $315,000

Joseph Sohm // Shutterstock
#10. Portland, ME metro area
– Average sale to list ratio: 1.013
– Total homes sold: 91
– Median sale price: $429,900

Wisconsin Department of Natural Resources // Flickr
#9. Sheboygan, WI metro area
– Average sale to list ratio: 1.013
– Total homes sold: 15
– Median sale price: $240,000

Smallbones // Wikimedia Commons
#8. Lancaster, PA metro area
– Average sale to list ratio: 1.014
– Total homes sold: 68
– Median sale price: $293,000
John Phelan // Wikicommons
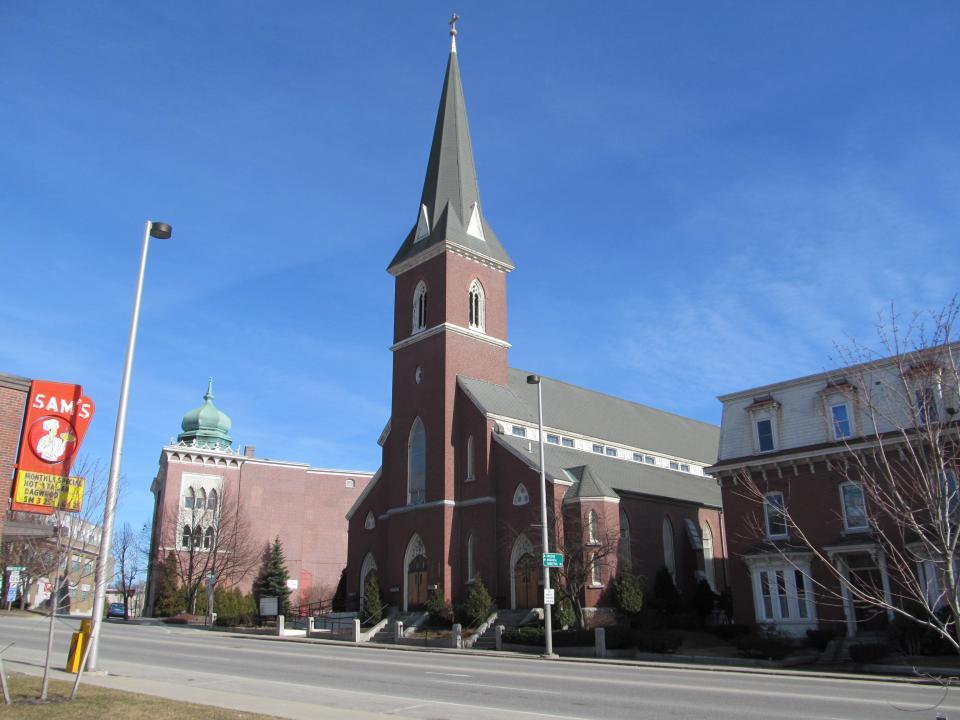
#7. Lewiston, ME metro area
– Average sale to list ratio: 1.015
– Total homes sold: 17
– Median sale price: $305,000

Royalbroil // Wikimedia Commons
#6. Appleton, WI metro area
– Average sale to list ratio: 1.021
– Total homes sold: 37
– Median sale price: $318,000

Stephen Zimmermann // Wikimedia Commons
#5. Buffalo, NY metro area
– Average sale to list ratio: 1.021
– Total homes sold: 95
– Median sale price: $215,000

Potomac Sun Photography // Wikimedia
#4. California, MD metro area
– Average sale to list ratio: 1.026
– Total homes sold: 18
– Median sale price: $380,000
Creative Commons
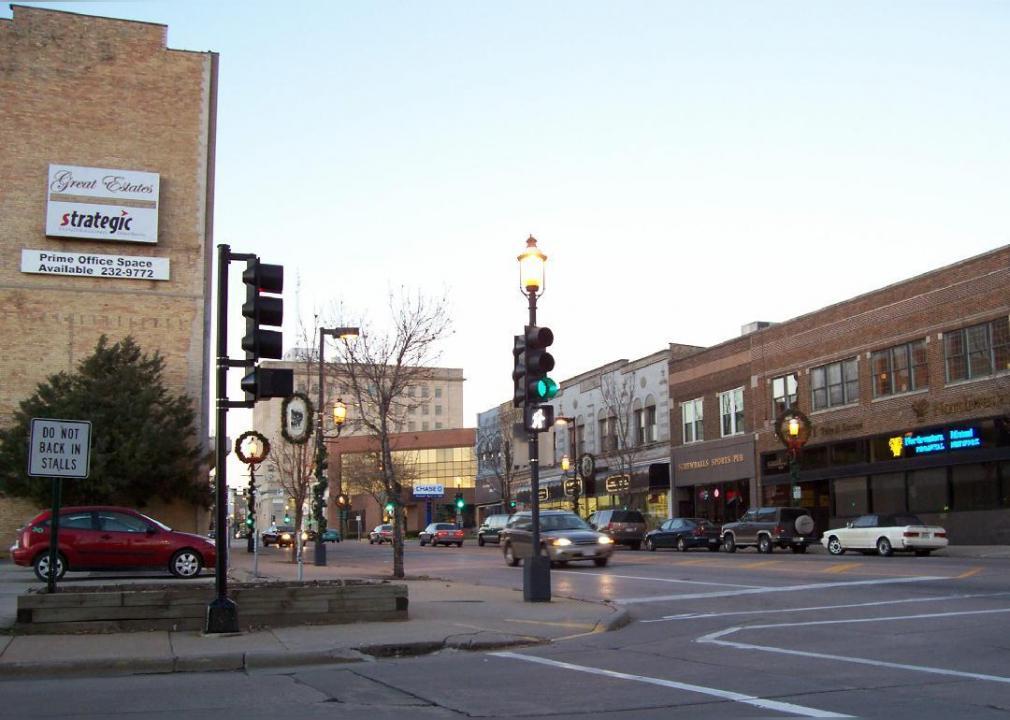
#3. Oshkosh, WI metro area
– Average sale to list ratio: 1.026
– Total homes sold: 33
– Median sale price: $242,000

Theresa Marconi // Wikimedia Commons
#2. Rochester, NY metro area
– Average sale to list ratio: 1.049
– Total homes sold: 137
– Median sale price: $219,000

jmd41280 // Flickr
#1. Chambersburg, PA metro area
– Average sale to list ratio: 1.074
– Total homes sold: 25
– Median sale price: $210,000