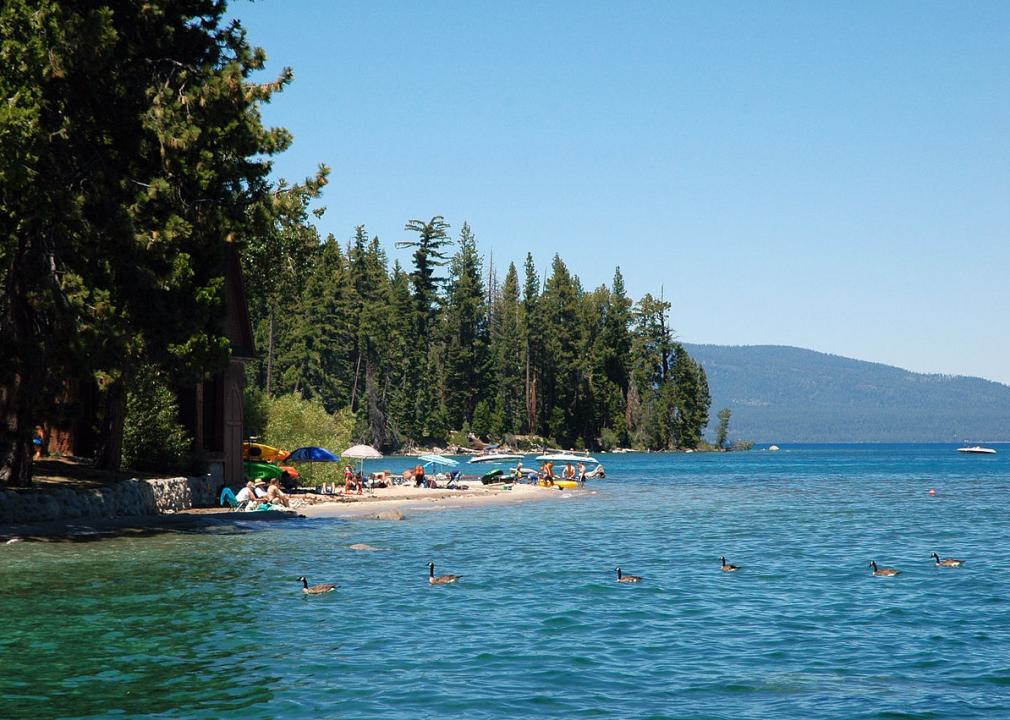
Counties with the most born-and-bred residents in California
Canva
Counties with the most born-and-bred residents in California
The COVID-19 pandemic, rising inflation and a higher cost of living in major cities have combined with opportunities for remote work over the past two years. This combination has fueled a major migration across the country. In the first year of the pandemic, migration out of densely populated, expensive cities like New York and San Francisco was especially notable. Many moved to Sunbelt cities where the weather is warmer and the cost of living significantly lower.
But not everyone who moved in recent years went very far. Analysis of movement out of crowded cities shows that many of those leaving city centers moved into nearby suburbs in the same state, rather than making cross country moves.
Other trends suggest that many people are sticking close to home, remaining in or moving back to the state, or even the town they were born in. Even before the pandemic, the number of younger adults living with their parents was on the rise, mostly due to financial difficulties. This economic hardship was made worse by the pandemic, and resulted in many moving back in with their parents. By the end of 2020, more than half of Americans under the age of 29 were living at home, exceeding the share of young adults living with their parents during the Great Depression.
Apart from the pandemic, many people choose not to leave the state they were raised in, for reasons ranging from wanting to be close to family to not having the resources to leave, to sticking with a lower cost of living.
In order to determine where people stay put, Stacker compiled a list of counties with the most born-and-bred residents in California using data from the U.S. Census Bureau. Counties are ranked by the highest percentage of residents that were born in the state according to 2020 5-year estimates.
You may also like: Most rural counties in California
![]()

Canva
#58. San Francisco
– Population: 874,784
– Born in California: 346,158 (39.6% of population)
– Born in a different state: 209,655 (24.0% of population)
— Midwest (6.4%), Northeast (7.7%), South (6.2%), West (3.6%)
– Born in another country: 299,510 (34.24% of population)
— Africa (0.53%) , Asia (22.05%), Europe (4.56%), Latin America (6.08%), North America (0.59%), Oceania (0.44%)
Uladzik Kryhin // Shutterstock
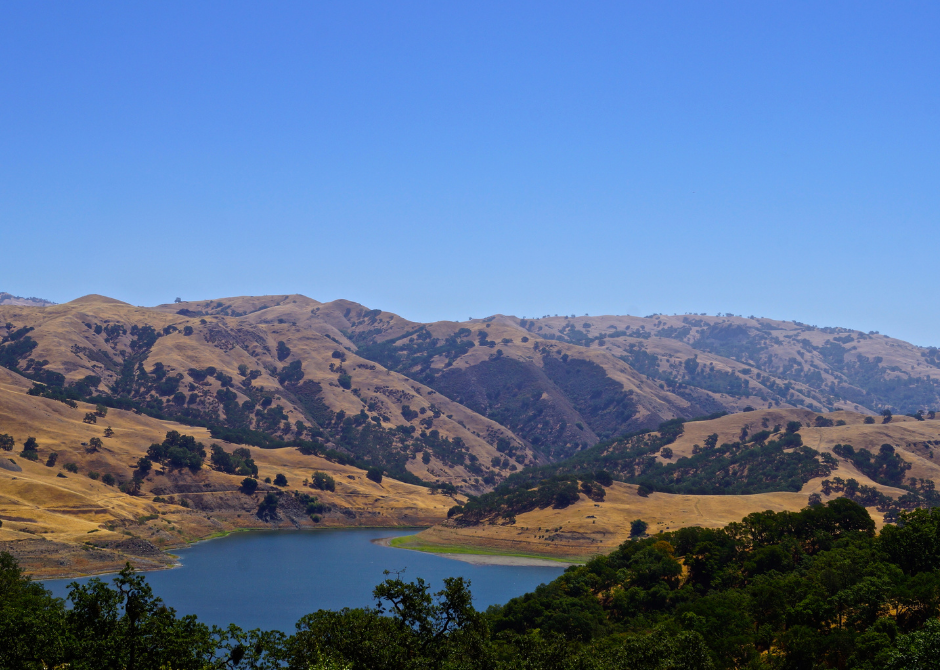
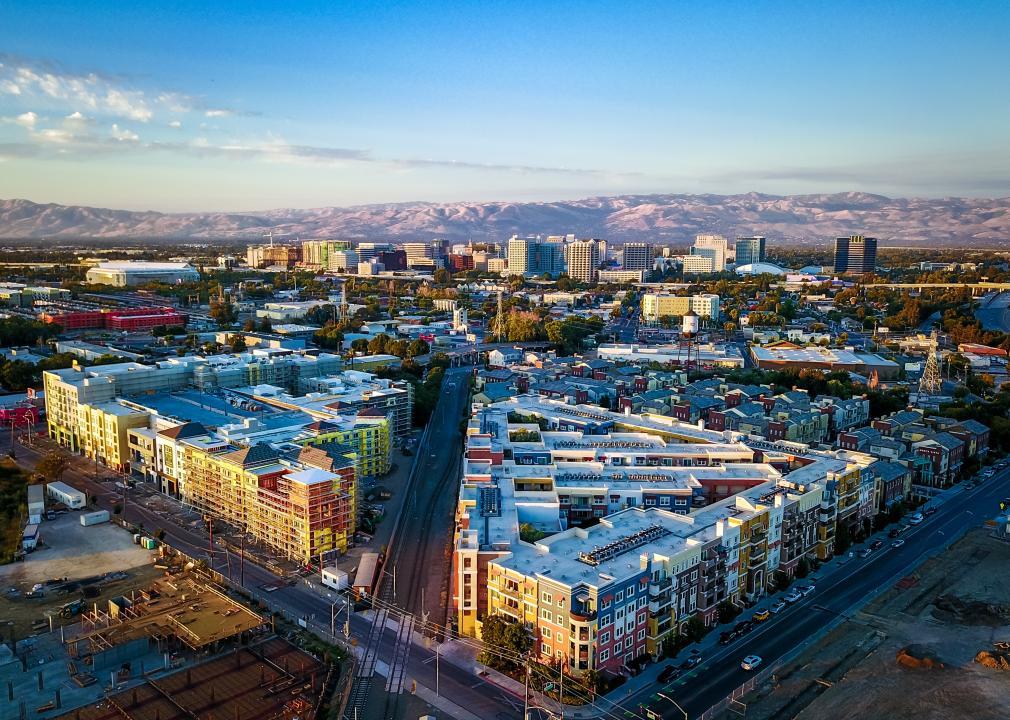
#57. Santa Clara County
– Population: 1,924,379
– Born in California: 860,789 (44.7% of population)
– Born in a different state: 267,759 (13.9% of population)
— Midwest (4.1%), Northeast (3.6%), South (3.3%), West (2.9%)
– Born in another country: 764,455 (39.72% of population)
— Africa (0.68%) , Asia (26.84%), Europe (3.16%), Latin America (8.34%), North America (0.50%), Oceania (0.21%)
Craig Howell // Wikimedia Commons
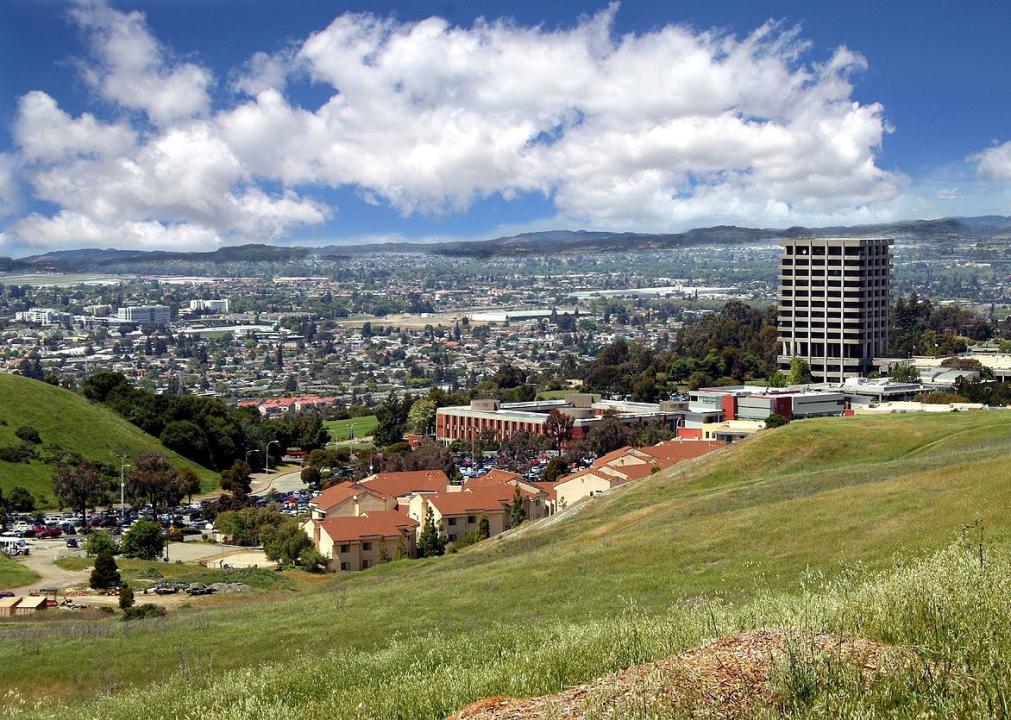
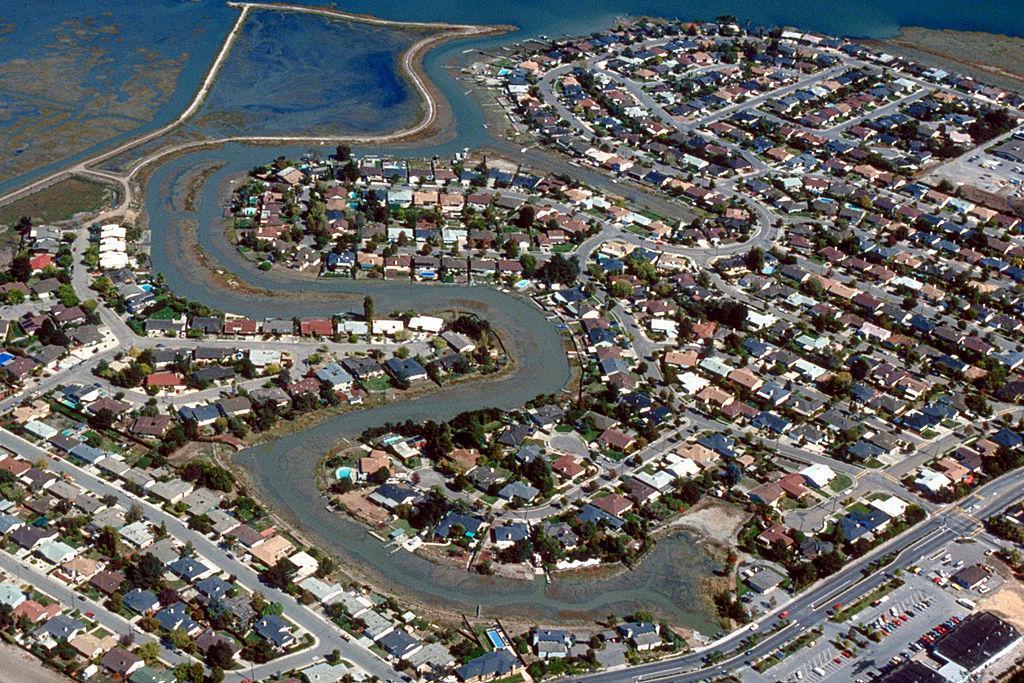
#56. San Mateo County
– Population: 765,623
– Born in California: 368,818 (48.2% of population)
– Born in a different state: 116,315 (15.2% of population)
— Midwest (4.3%), Northeast (4.6%), South (3.7%), West (2.7%)
– Born in another country: 267,622 (34.95% of population)
— Africa (0.47%) , Asia (19.30%), Europe (3.45%), Latin America (10.21%), North America (0.57%), Oceania (0.96%)
Jennifer Williams // Wikimedia Commons
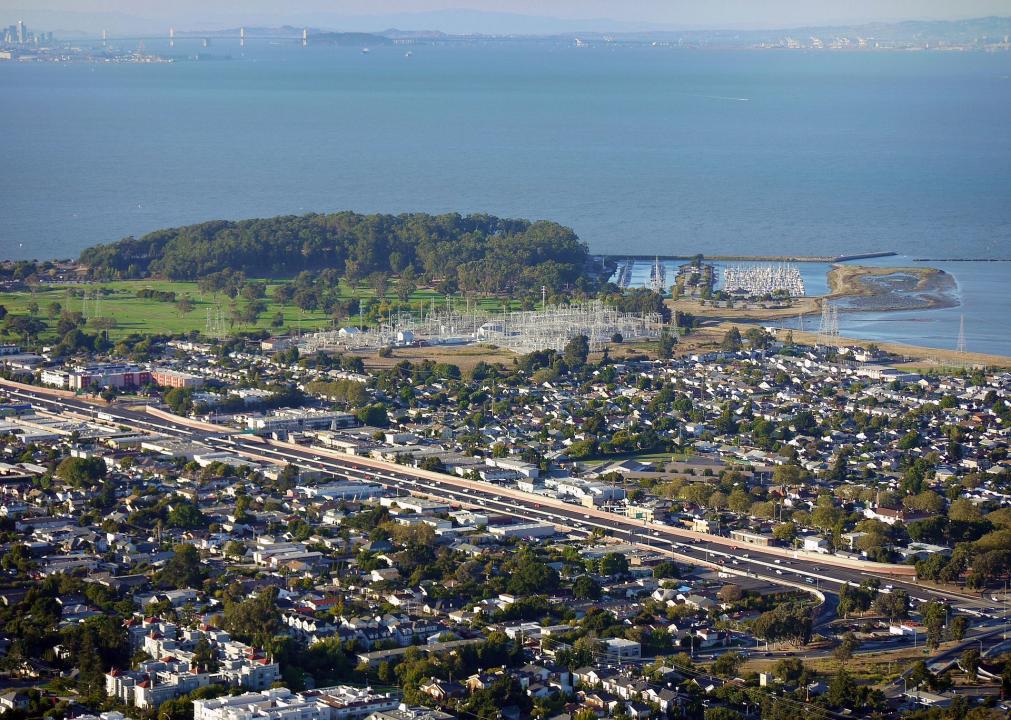
#55. Alameda County
– Population: 1,661,584
– Born in California: 818,106 (49.2% of population)
– Born in a different state: 272,445 (16.4% of population)
— Midwest (4.4%), Northeast (4.2%), South (4.7%), West (3.0%)
– Born in another country: 544,274 (32.76% of population)
— Africa (1.17%) , Asia (20.96%), Europe (1.89%), Latin America (7.87%), North America (0.34%), Oceania (0.52%)
SD Dirk // Flickr
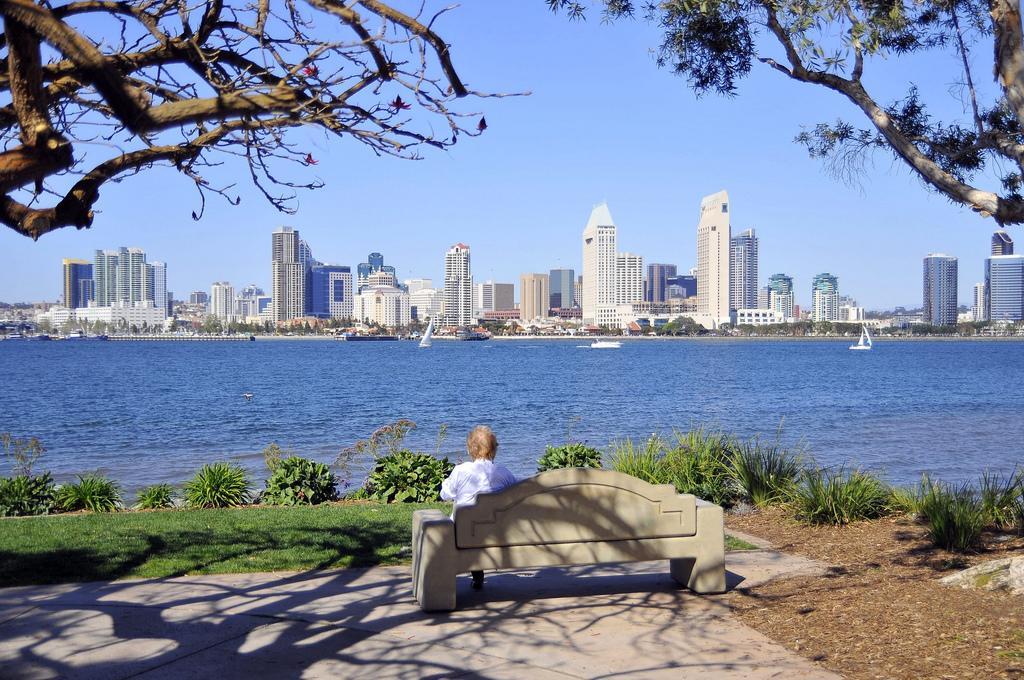
#54. San Diego County
– Population: 3,323,970
– Born in California: 1,670,915 (50.3% of population)
– Born in a different state: 824,666 (24.8% of population)
— Midwest (7.5%), Northeast (5.9%), South (6.6%), West (4.8%)
– Born in another country: 762,260 (22.93% of population)
— Africa (0.56%) , Asia (8.92%), Europe (1.83%), Latin America (11.13%), North America (0.36%), Oceania (0.12%)
You may also like: Highest-rated football recruits from California over the last 20 years
Kglavin // Wikimedia Commons
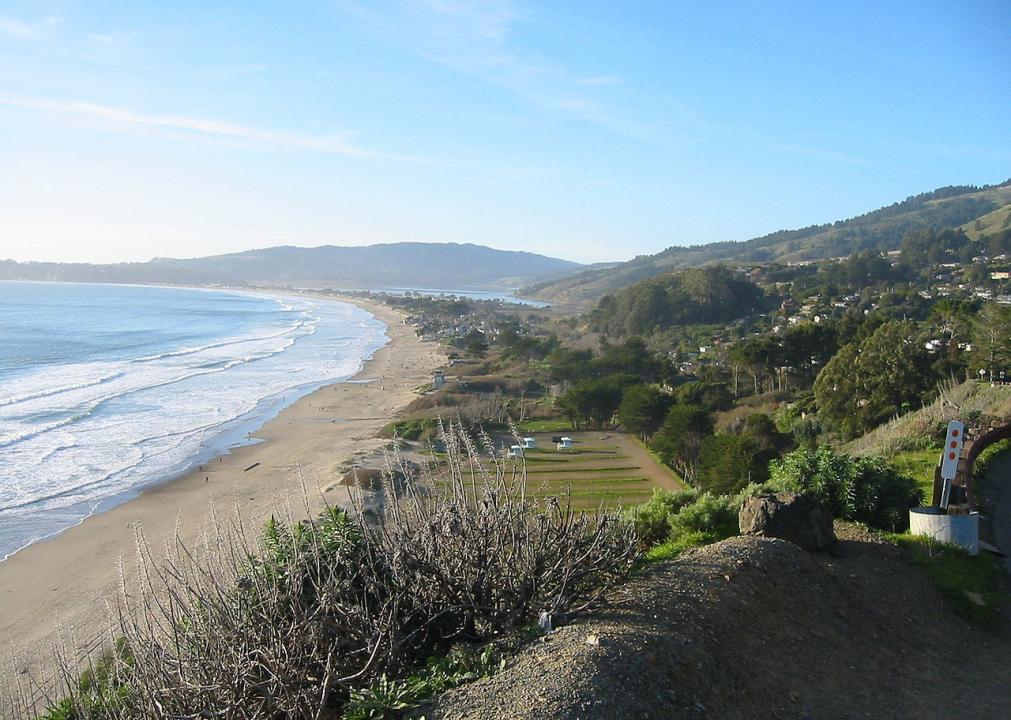
#53. Marin County
– Population: 259,441
– Born in California: 131,250 (50.6% of population)
– Born in a different state: 76,062 (29.3% of population)
— Midwest (8.8%), Northeast (10.7%), South (5.2%), West (4.6%)
– Born in another country: 47,381 (18.26% of population)
— Africa (0.64%) , Asia (4.26%), Europe (4.85%), Latin America (7.53%), North America (0.76%), Oceania (0.21%)
BDS2006 // Wikimedia
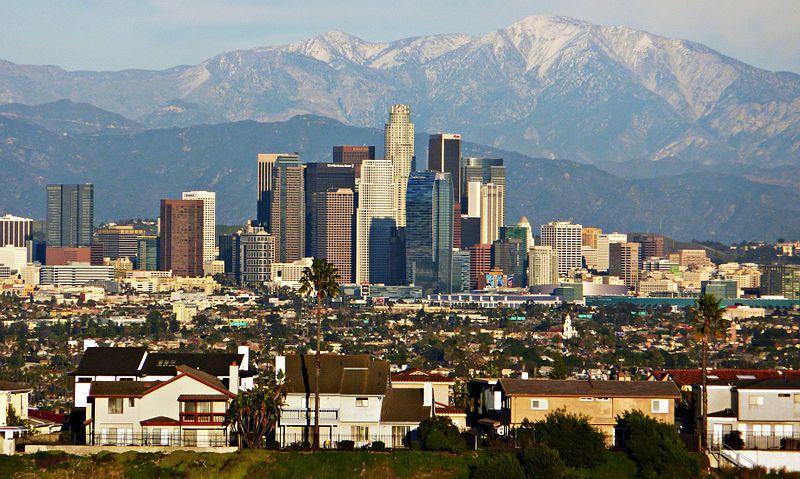
#52. Los Angeles County
– Population: 10,040,682
– Born in California: 5,201,093 (51.8% of population)
– Born in a different state: 1,331,188 (13.3% of population)
— Midwest (3.7%), Northeast (3.6%), South (3.9%), West (2.1%)
– Born in another country: 3,386,631 (33.73% of population)
— Africa (0.61%) , Asia (12.19%), Europe (1.71%), Latin America (18.77%), North America (0.29%), Oceania (0.15%)
Susan Popielaski // Wikimedia Commons
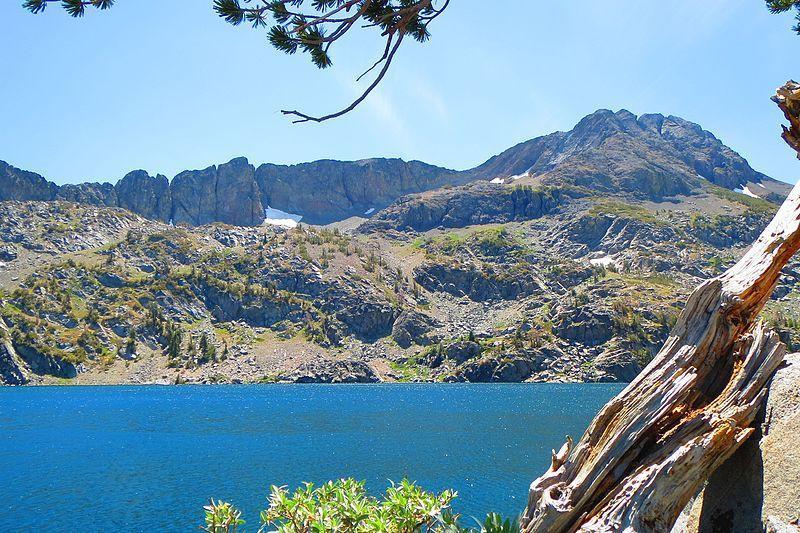
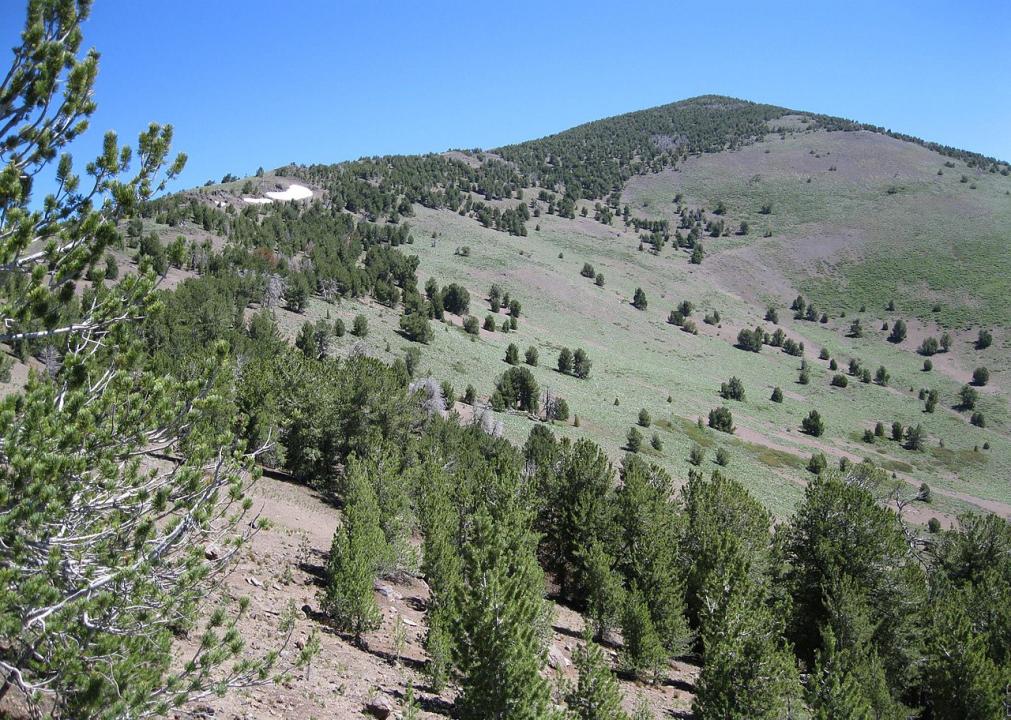
#51. Alpine County
– Population: 1,159
– Born in California: 613 (52.9% of population)
– Born in a different state: 463 (39.9% of population)
— Midwest (4.8%), Northeast (5.9%), South (3.9%), West (25.4%)
– Born in another country: 73 (6.30% of population)
— Africa (0.00%) , Asia (0.95%), Europe (1.21%), Latin America (3.97%), North America (0.17%), Oceania (0.00%)
Hollywood // Wikimedia Commons
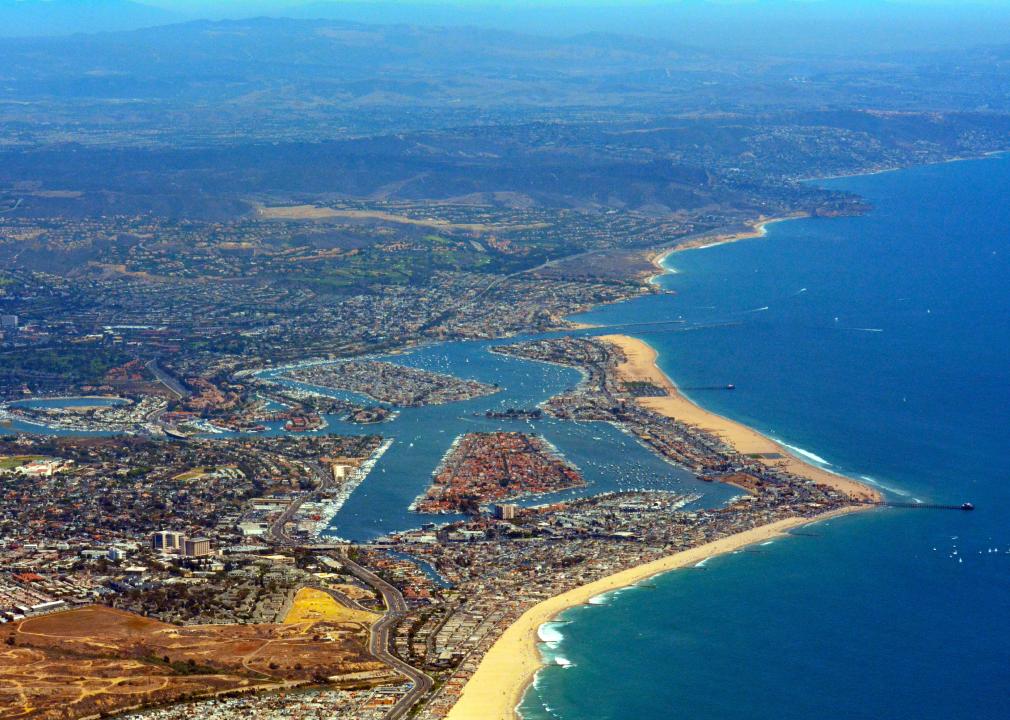
#50. Orange County
– Population: 3,170,345
– Born in California: 1,686,012 (53.2% of population)
– Born in a different state: 497,911 (15.7% of population)
— Midwest (5.4%), Northeast (3.9%), South (3.3%), West (3.1%)
– Born in another country: 939,029 (29.62% of population)
— Africa (0.60%) , Asia (14.82%), Europe (1.69%), Latin America (11.94%), North America (0.41%), Oceania (0.15%)
Canva
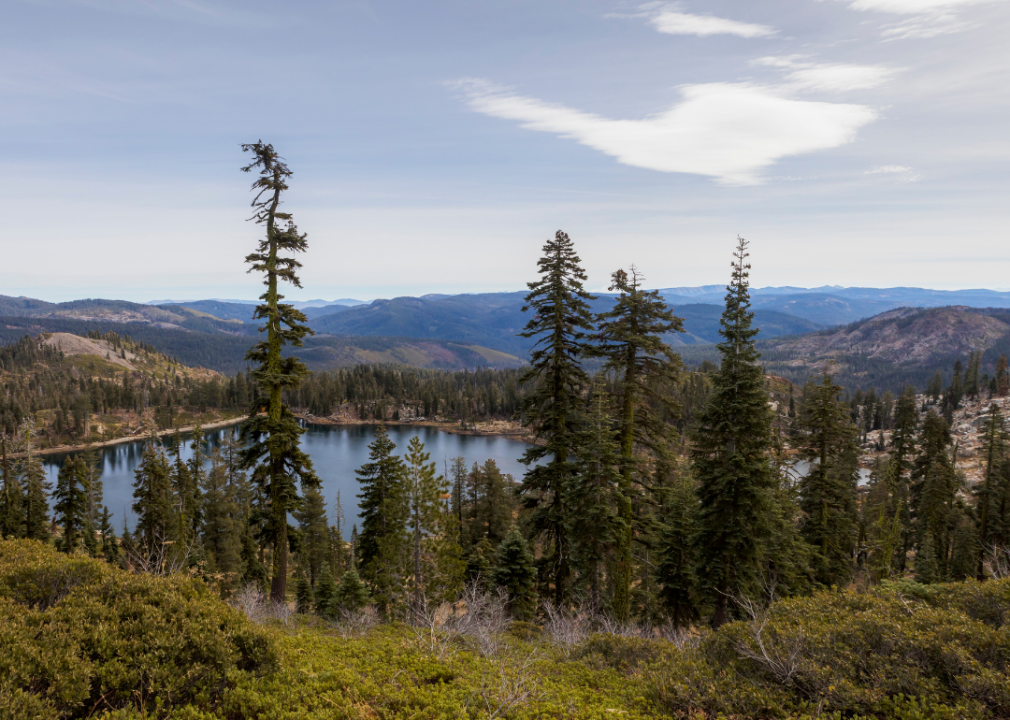
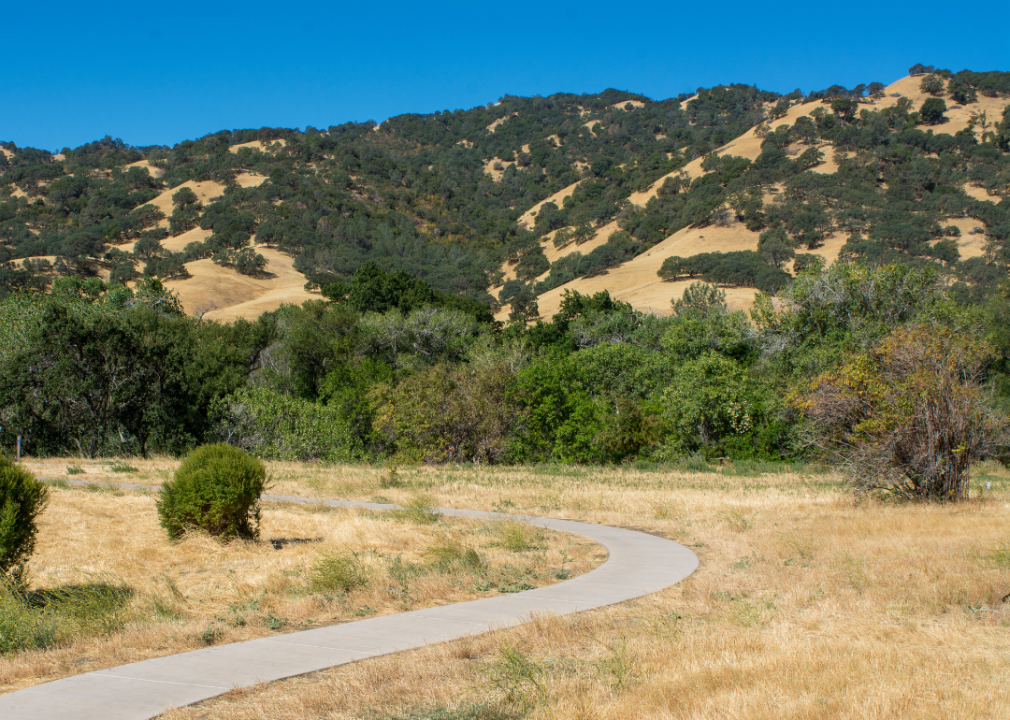
#49. Sierra County
– Population: 2,898
– Born in California: 1,589 (54.8% of population)
– Born in a different state: 1,232 (42.5% of population)
— Midwest (6.4%), Northeast (7.9%), South (7.5%), West (20.7%)
– Born in another country: 56 (1.93% of population)
— Africa (0.00%) , Asia (0.00%), Europe (0.00%), Latin America (1.93%), North America (0.00%), Oceania (0.00%)
You may also like: Countries California exports the most goods to

Naotake Murayama // Wikicommons
#48. Monterey County
– Population: 432,977
– Born in California: 239,637 (55.3% of population)
– Born in a different state: 60,396 (13.9% of population)
— Midwest (3.8%), Northeast (2.8%), South (4.1%), West (3.2%)
– Born in another country: 125,431 (28.97% of population)
— Africa (0.19%) , Asia (3.62%), Europe (1.32%), Latin America (23.48%), North America (0.17%), Oceania (0.20%)
MARELBU // Wikimedia Commons
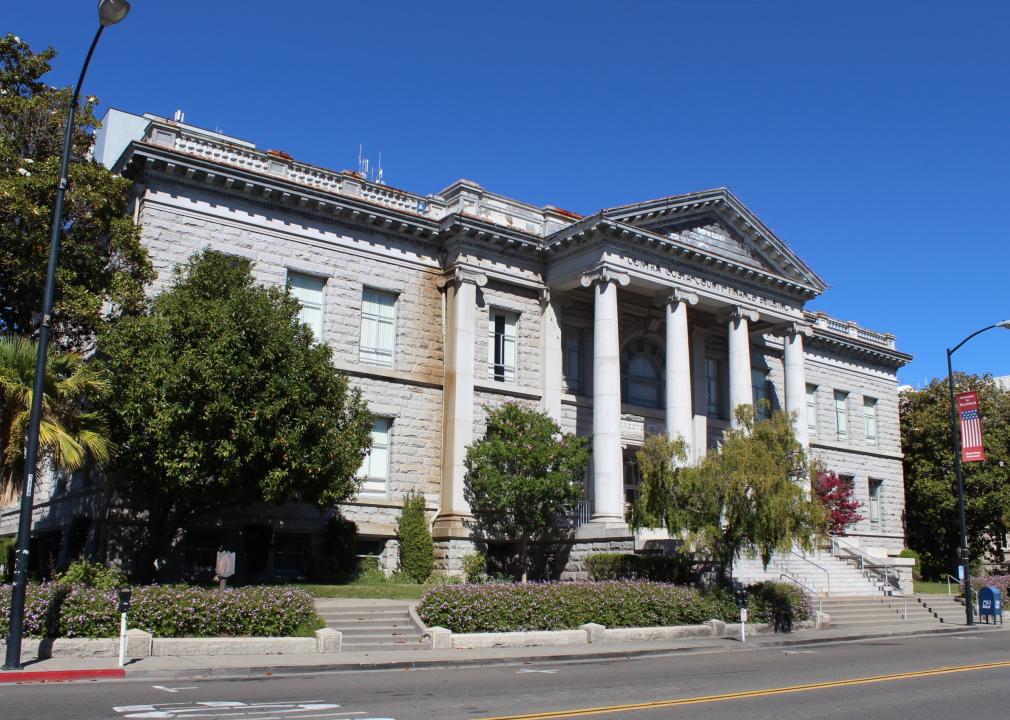
#47. Contra Costa County
– Population: 1,147,788
– Born in California: 645,540 (56.2% of population)
– Born in a different state: 198,233 (17.3% of population)
— Midwest (5.1%), Northeast (4.2%), South (4.7%), West (3.3%)
– Born in another country: 285,120 (24.84% of population)
— Africa (0.94%) , Asia (11.74%), Europe (1.95%), Latin America (9.50%), North America (0.36%), Oceania (0.35%)
Pixabay
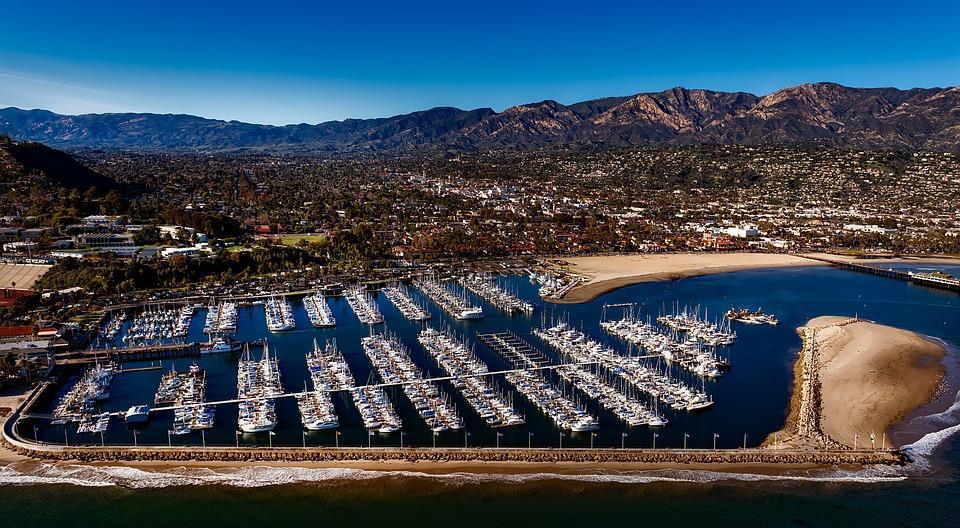
#46. Santa Barbara County
– Population: 444,895
– Born in California: 255,509 (57.4% of population)
– Born in a different state: 82,634 (18.6% of population)
— Midwest (5.8%), Northeast (4.4%), South (4.2%), West (4.1%)
– Born in another country: 100,908 (22.68% of population)
— Africa (0.24%) , Asia (3.48%), Europe (1.86%), Latin America (16.60%), North America (0.37%), Oceania (0.14%)
Scott Burley // Wikimedia Commons
#45. Modoc County
– Population: 8,853
– Born in California: 5,135 (58.0% of population)
– Born in a different state: 2,999 (33.9% of population)
— Midwest (5.6%), Northeast (2.5%), South (6.2%), West (19.5%)
– Born in another country: 672 (7.59% of population)
— Africa (0.00%) , Asia (1.65%), Europe (0.99%), Latin America (4.80%), North America (0.15%), Oceania (0.00%)

Stan Shebs // Wikicommons
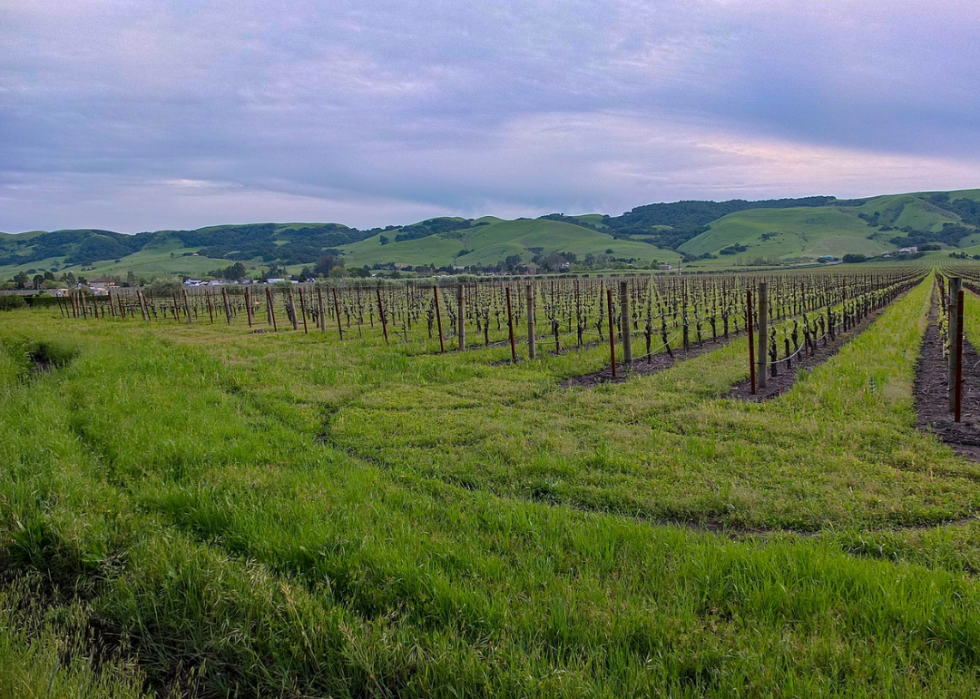
#44. Napa County
– Population: 138,572
– Born in California: 80,930 (58.4% of population)
– Born in a different state: 26,163 (18.9% of population)
— Midwest (6.0%), Northeast (4.2%), South (4.2%), West (4.5%)
– Born in another country: 29,382 (21.20% of population)
— Africa (0.25%) , Asia (4.79%), Europe (1.75%), Latin America (13.77%), North America (0.49%), Oceania (0.15%)
You may also like: Counties with the highest COVID-19 death rate in California
Canva
#43. Solano County
– Population: 444,538
– Born in California: 260,394 (58.6% of population)
– Born in a different state: 86,091 (19.4% of population)
— Midwest (5.3%), Northeast (2.9%), South (7.0%), West (4.2%)
– Born in another country: 87,740 (19.74% of population)
— Africa (0.38%) , Asia (9.62%), Europe (1.11%), Latin America (8.12%), North America (0.24%), Oceania (0.27%)

Cbl62 // Wikicommons
#42. Imperial County
– Population: 180,580
– Born in California: 107,776 (59.7% of population)
– Born in a different state: 13,371 (7.4% of population)
— Midwest (1.5%), Northeast (0.5%), South (2.0%), West (3.4%)
– Born in another country: 54,366 (30.11% of population)
— Africa (0.11%) , Asia (0.74%), Europe (0.10%), Latin America (29.04%), North America (0.08%), Oceania (0.02%)
Canva
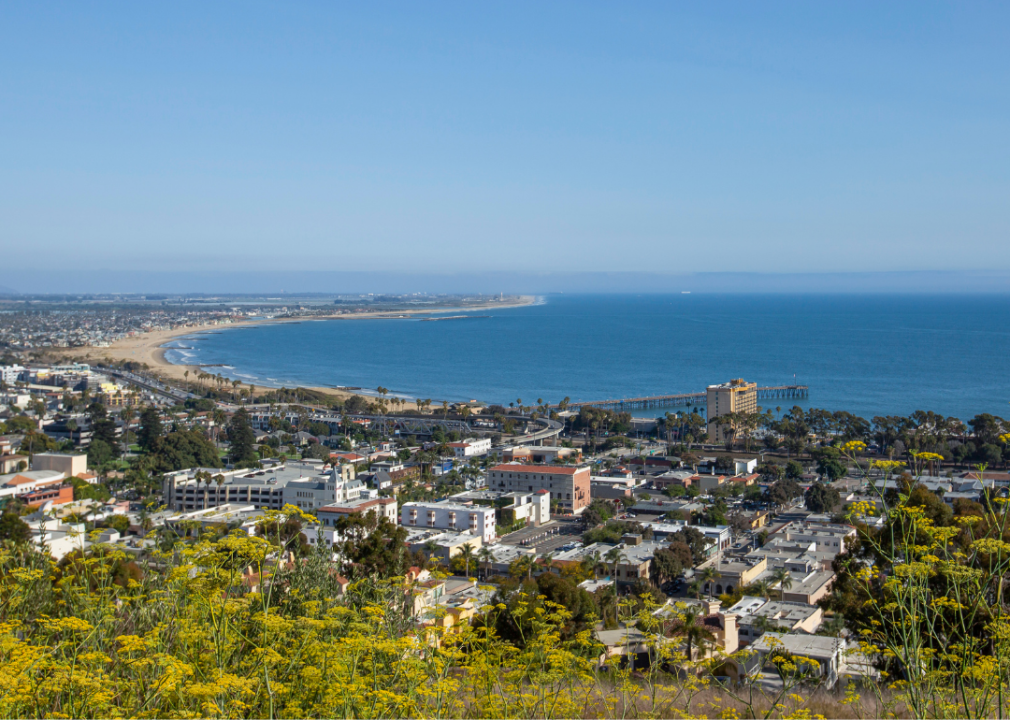
#41. Ventura County
– Population: 845,599
– Born in California: 507,907 (60.1% of population)
– Born in a different state: 147,753 (17.5% of population)
— Midwest (5.6%), Northeast (4.6%), South (4.0%), West (3.3%)
– Born in another country: 179,940 (21.28% of population)
— Africa (0.22%) , Asia (5.13%), Europe (1.48%), Latin America (13.86%), North America (0.47%), Oceania (0.13%)
Epolk // Wikimedia Commons
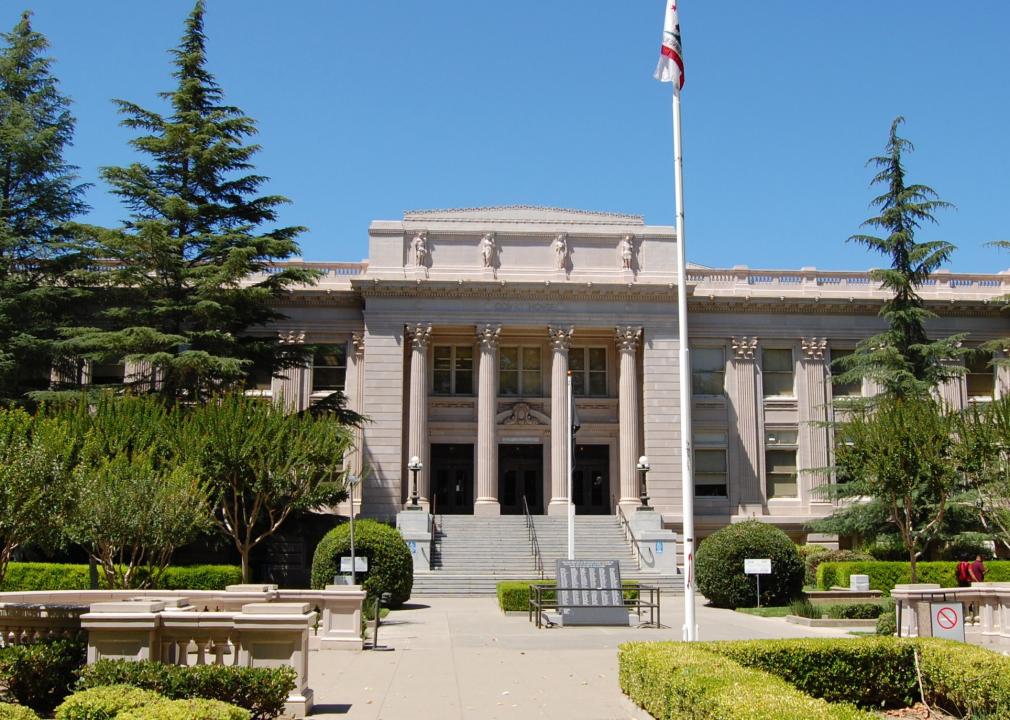
#40. Yolo County
– Population: 218,774
– Born in California: 131,831 (60.3% of population)
– Born in a different state: 33,777 (15.4% of population)
— Midwest (4.7%), Northeast (3.1%), South (3.9%), West (3.7%)
– Born in another country: 49,253 (22.51% of population)
— Africa (0.26%) , Asia (9.13%), Europe (2.26%), Latin America (10.21%), North America (0.30%), Oceania (0.36%)
Daniel Orth // Flickr
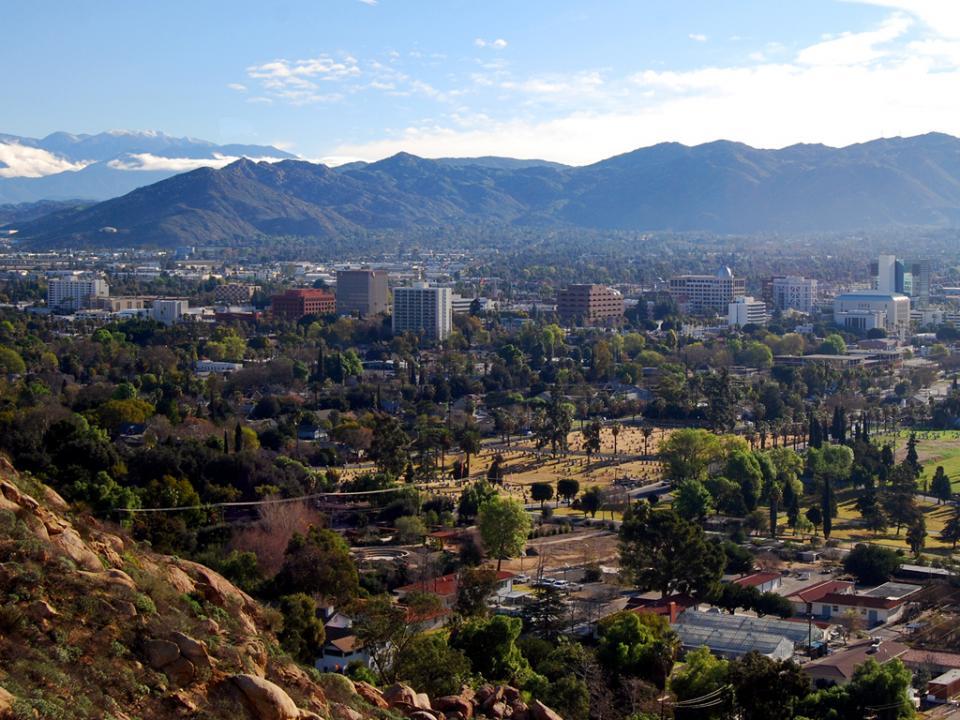
#39. Riverside County
– Population: 2,437,864
– Born in California: 1,481,602 (60.8% of population)
– Born in a different state: 398,804 (16.4% of population)
— Midwest (5.4%), Northeast (3.2%), South (4.2%), West (3.5%)
– Born in another country: 523,352 (21.47% of population)
— Africa (0.44%) , Asia (4.63%), Europe (1.06%), Latin America (14.76%), North America (0.47%), Oceania (0.11%)
You may also like: Best places to raise a family in California

Canva
#38. Sacramento County
– Population: 1,537,948
– Born in California: 937,572 (61.0% of population)
– Born in a different state: 254,973 (16.6% of population)
— Midwest (4.8%), Northeast (2.9%), South (4.7%), West (4.2%)
– Born in another country: 321,626 (20.91% of population)
— Africa (0.58%) , Asia (10.48%), Europe (2.98%), Latin America (5.83%), North America (0.20%), Oceania (0.84%)
Aaronbrick // Wikicommons
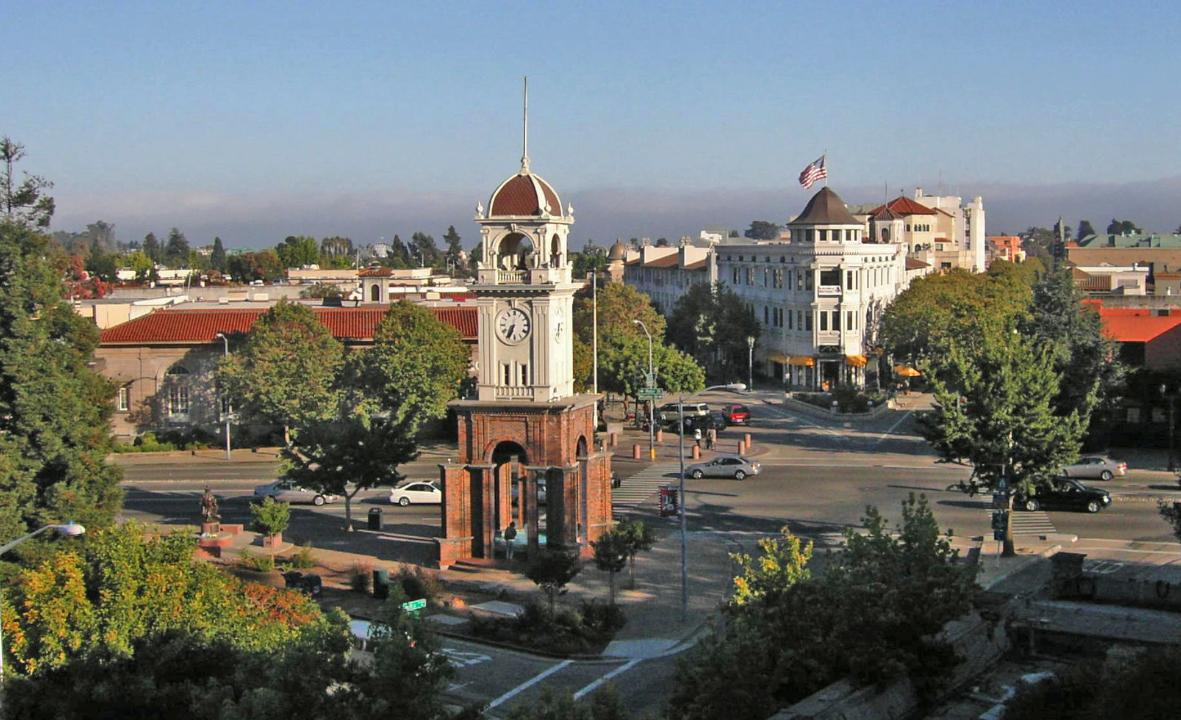
#37. Santa Cruz County
– Population: 273,170
– Born in California: 166,605 (61.0% of population)
– Born in a different state: 53,895 (19.7% of population)
— Midwest (5.9%), Northeast (5.6%), South (4.1%), West (4.1%)
– Born in another country: 47,899 (17.53% of population)
— Africa (0.26%) , Asia (2.89%), Europe (2.32%), Latin America (11.38%), North America (0.51%), Oceania (0.17%)
Ray Bouknight // Wikicommons
#36. Sutter County
– Population: 96,315
– Born in California: 58,834 (61.1% of population)
– Born in a different state: 14,236 (14.8% of population)
— Midwest (3.7%), Northeast (2.2%), South (4.6%), West (4.3%)
– Born in another country: 20,945 (21.75% of population)
— Africa (0.06%) , Asia (10.63%), Europe (0.53%), Latin America (10.20%), North America (0.14%), Oceania (0.18%)
Fred Hsu // Wikicommons
#35. Sonoma County
– Population: 496,801
– Born in California: 306,858 (61.8% of population)
– Born in a different state: 100,766 (20.3% of population)
— Midwest (6.2%), Northeast (5.4%), South (4.1%), West (4.6%)
– Born in another country: 82,422 (16.59% of population)
— Africa (0.45%) , Asia (3.02%), Europe (1.91%), Latin America (10.50%), North America (0.36%), Oceania (0.35%)
clr_flickr from Rocklin, USA // Wikimedia Commons
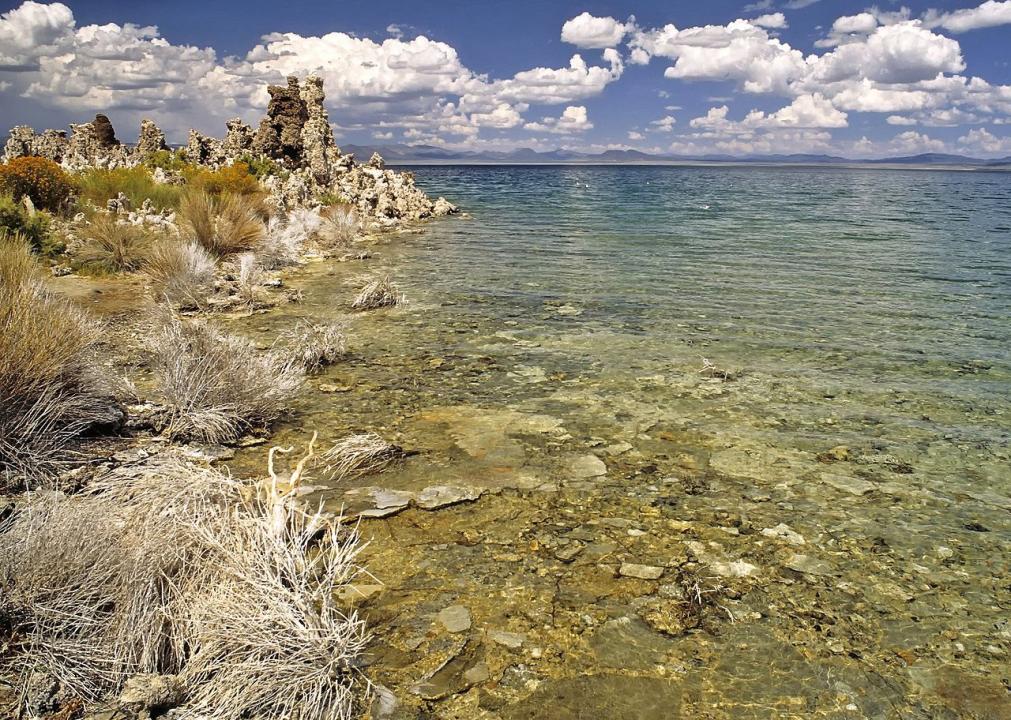
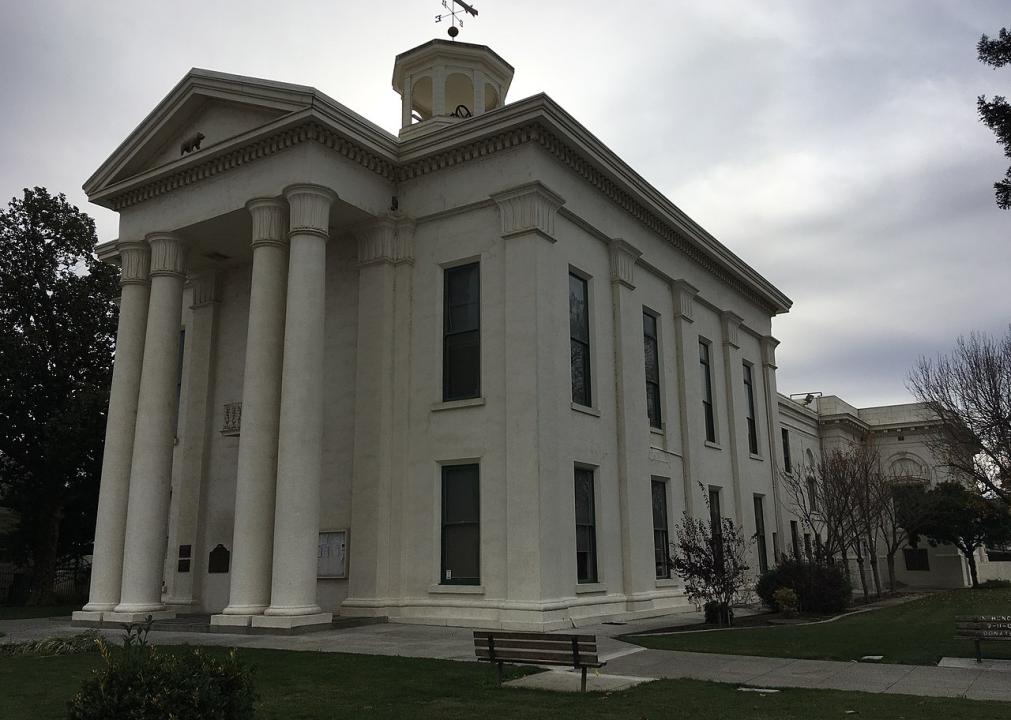
#34. Mono County
– Population: 14,395
– Born in California: 8,893 (61.8% of population)
– Born in a different state: 3,160 (22.0% of population)
— Midwest (5.6%), Northeast (4.2%), South (3.9%), West (8.2%)
– Born in another country: 2,295 (15.94% of population)
— Africa (0.60%) , Asia (2.91%), Europe (0.60%), Latin America (9.53%), North America (1.61%), Oceania (0.69%)
You may also like: Counties with the oldest homes in California
Mark Miller // Wikimedia Commons
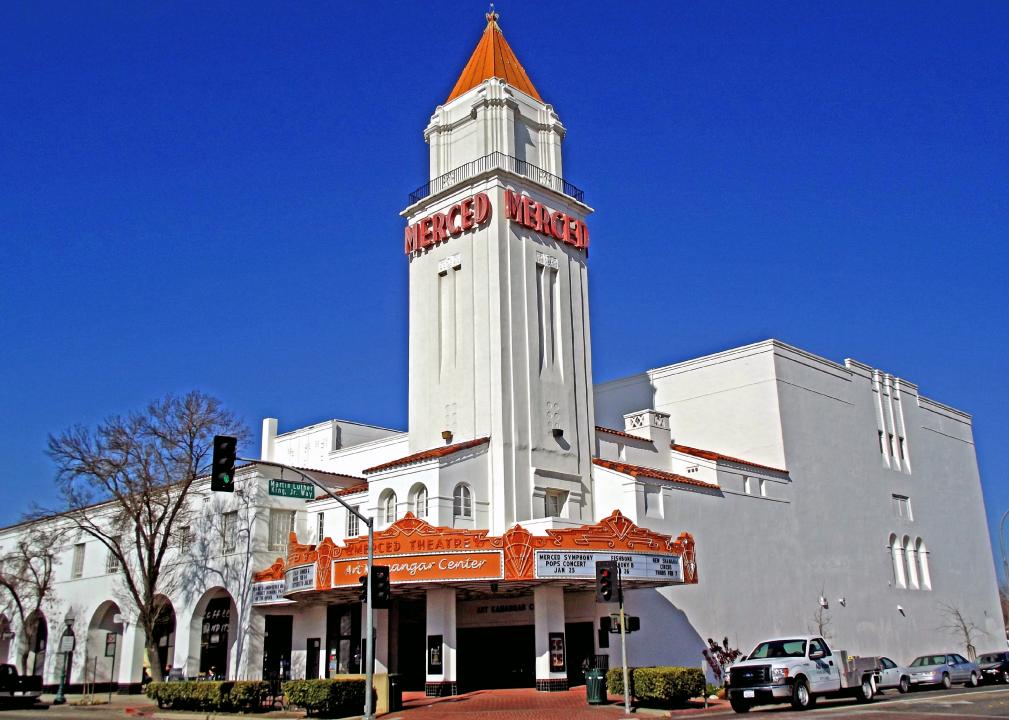
#33. Merced County
– Population: 273,661
– Born in California: 172,802 (63.1% of population)
– Born in a different state: 25,993 (9.5% of population)
— Midwest (2.2%), Northeast (1.2%), South (3.4%), West (2.7%)
– Born in another country: 72,267 (26.41% of population)
— Africa (0.13%) , Asia (4.21%), Europe (1.69%), Latin America (20.22%), North America (0.09%), Oceania (0.07%)
CleanWater17 // Wikimedia Commons
#32. Colusa County
– Population: 21,491
– Born in California: 13,640 (63.5% of population)
– Born in a different state: 1,755 (8.2% of population)
— Midwest (2.6%), Northeast (1.1%), South (2.6%), West (1.8%)
– Born in another country: 5,969 (27.77% of population)
— Africa (0.00%) , Asia (0.61%), Europe (0.87%), Latin America (26.07%), North America (0.19%), Oceania (0.04%)
Frank Schulenburg // Wikimedia Commons
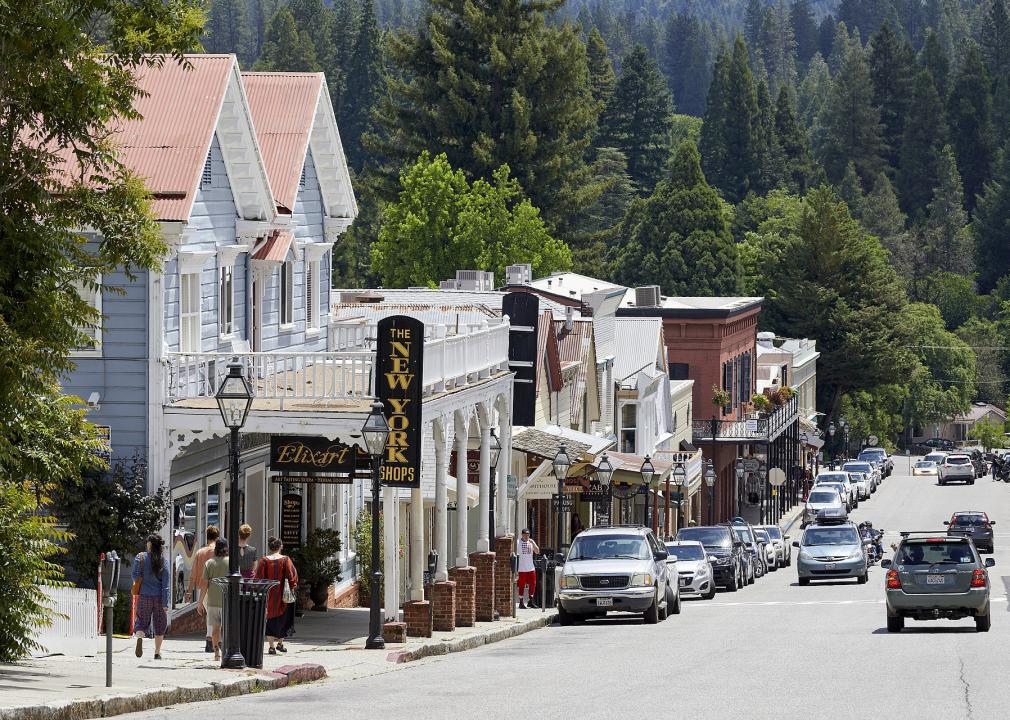
#31. Nevada County
– Population: 99,417
– Born in California: 63,605 (64.0% of population)
– Born in a different state: 28,792 (29.0% of population)
— Midwest (9.9%), Northeast (6.4%), South (5.3%), West (7.4%)
– Born in another country: 5,719 (5.75% of population)
— Africa (0.01%) , Asia (0.81%), Europe (1.98%), Latin America (2.22%), North America (0.60%), Oceania (0.12%)
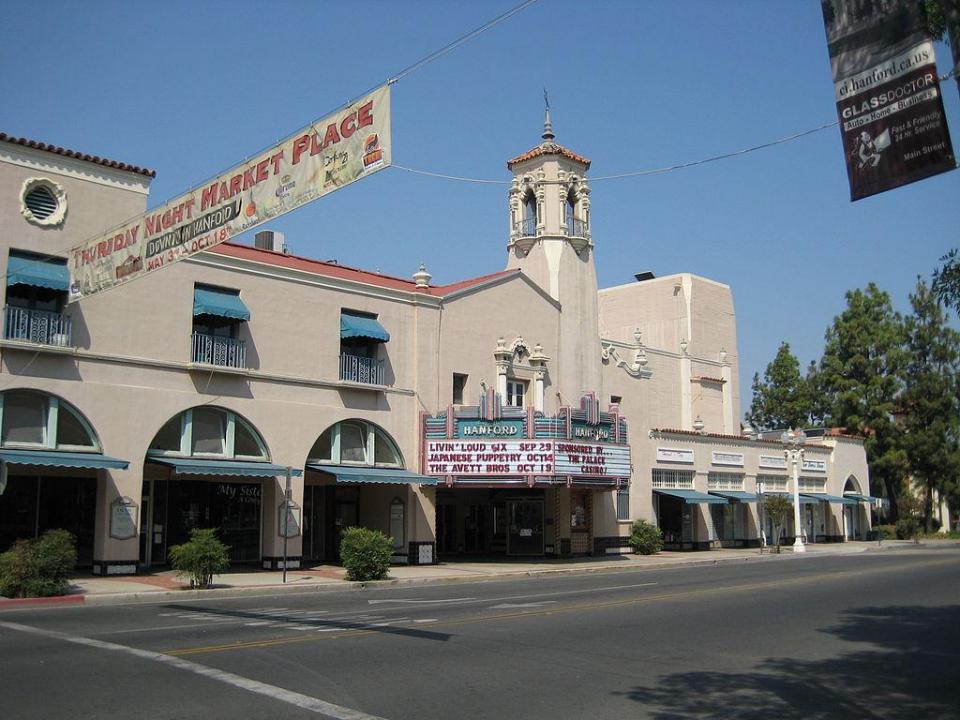
Armona // Wikicommons
#30. Kings County
– Population: 151,090
– Born in California: 96,689 (64.0% of population)
– Born in a different state: 23,001 (15.2% of population)
— Midwest (3.1%), Northeast (1.7%), South (6.8%), West (3.6%)
– Born in another country: 29,410 (19.47% of population)
— Africa (0.50%) , Asia (2.31%), Europe (0.65%), Latin America (15.79%), North America (0.16%), Oceania (0.05%)
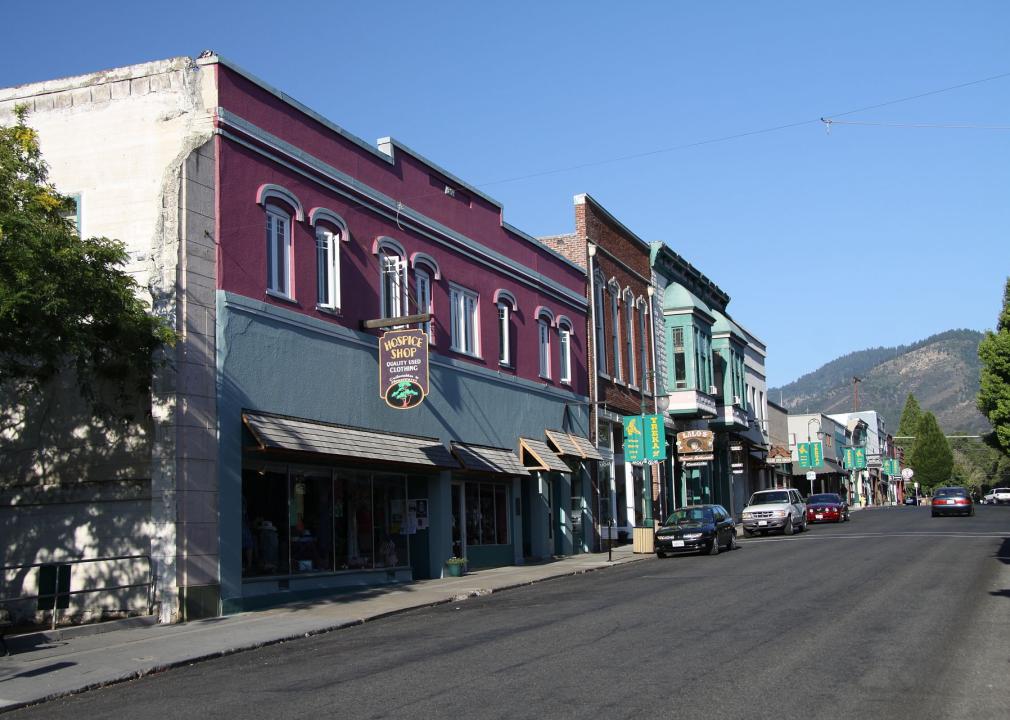
Chmee2 // Wikimedia Commons
#29. Siskiyou County
– Population: 43,516
– Born in California: 28,103 (64.6% of population)
– Born in a different state: 12,314 (28.3% of population)
— Midwest (6.6%), Northeast (2.8%), South (5.2%), West (13.7%)
– Born in another country: 2,572 (5.91% of population)
— Africa (0.02%) , Asia (0.94%), Europe (1.19%), Latin America (3.12%), North America (0.38%), Oceania (0.27%)
You may also like: Highest NFL draft picks from California
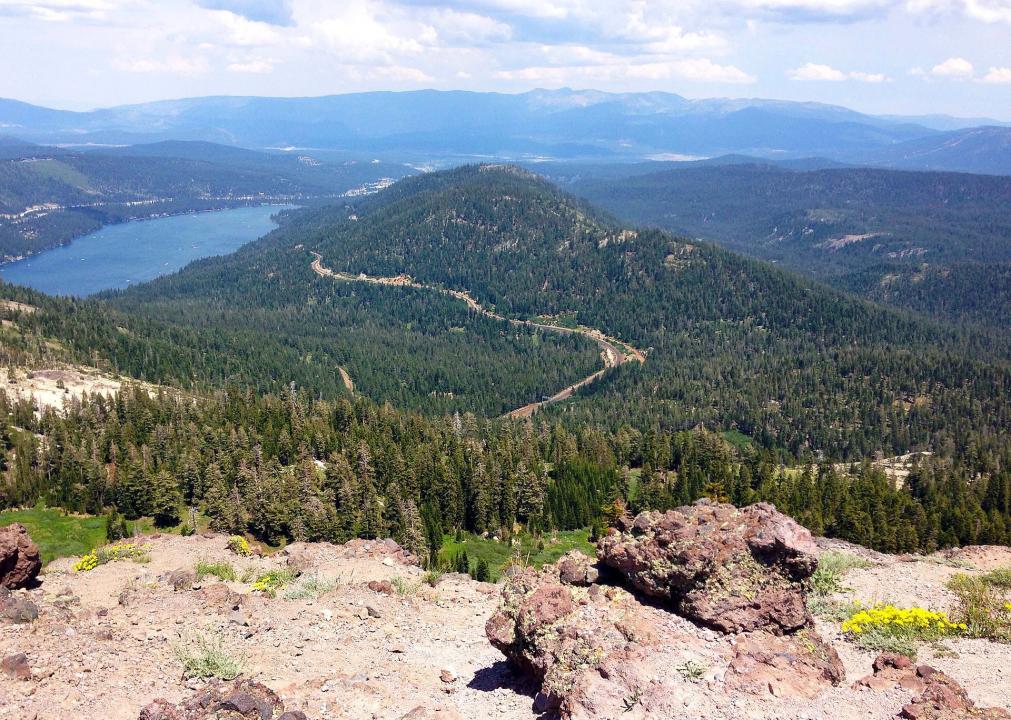
Doug Olson // Wikimedia Commons
#28. Placer County
– Population: 391,799
– Born in California: 253,369 (64.7% of population)
– Born in a different state: 88,665 (22.6% of population)
— Midwest (6.8%), Northeast (4.1%), South (4.7%), West (7.0%)
– Born in another country: 44,263 (11.30% of population)
— Africa (0.33%) , Asia (5.50%), Europe (2.32%), Latin America (2.56%), North America (0.43%), Oceania (0.16%)
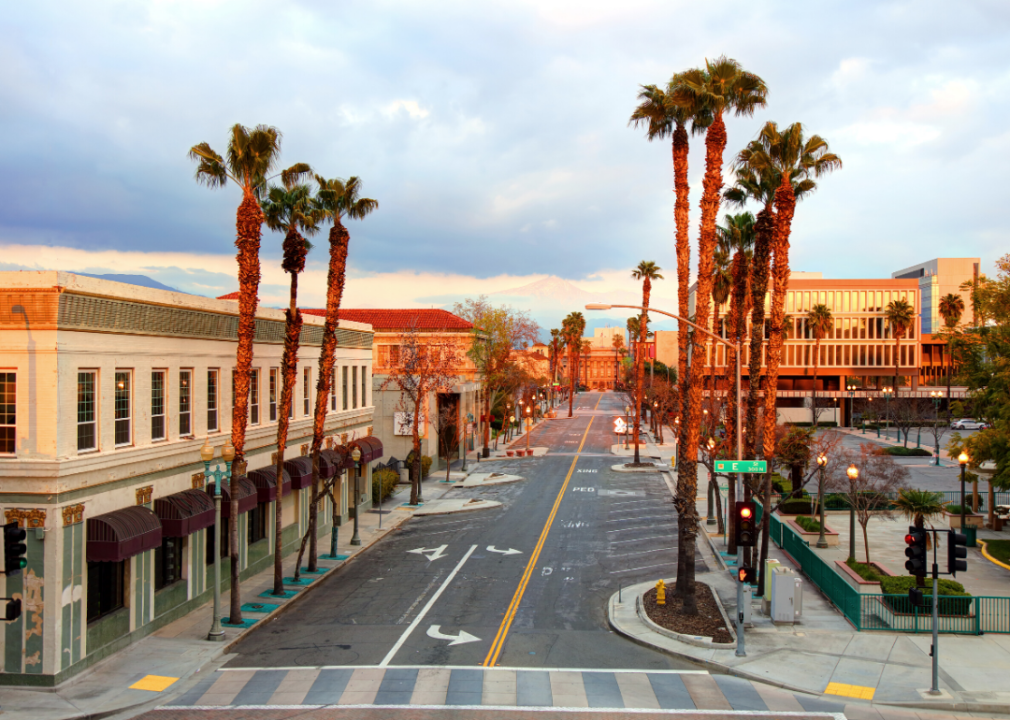
Canva
#27. San Bernardino County
– Population: 2,162,532
– Born in California: 1,408,335 (65.1% of population)
– Born in a different state: 281,548 (13.0% of population)
— Midwest (3.8%), Northeast (2.2%), South (4.1%), West (3.0%)
– Born in another country: 447,124 (20.68% of population)
— Africa (0.45%) , Asia (5.20%), Europe (0.62%), Latin America (14.17%), North America (0.17%), Oceania (0.07%)
DimiTalen // Wikimedia Commons
#26. El Dorado County
– Population: 190,345
– Born in California: 124,026 (65.2% of population)
– Born in a different state: 46,488 (24.4% of population)
— Midwest (7.3%), Northeast (4.9%), South (5.3%), West (7.0%)
– Born in another country: 17,695 (9.30% of population)
— Africa (0.12%) , Asia (3.49%), Europe (2.28%), Latin America (2.62%), North America (0.48%), Oceania (0.32%)
LPS.1 // Wikicommons
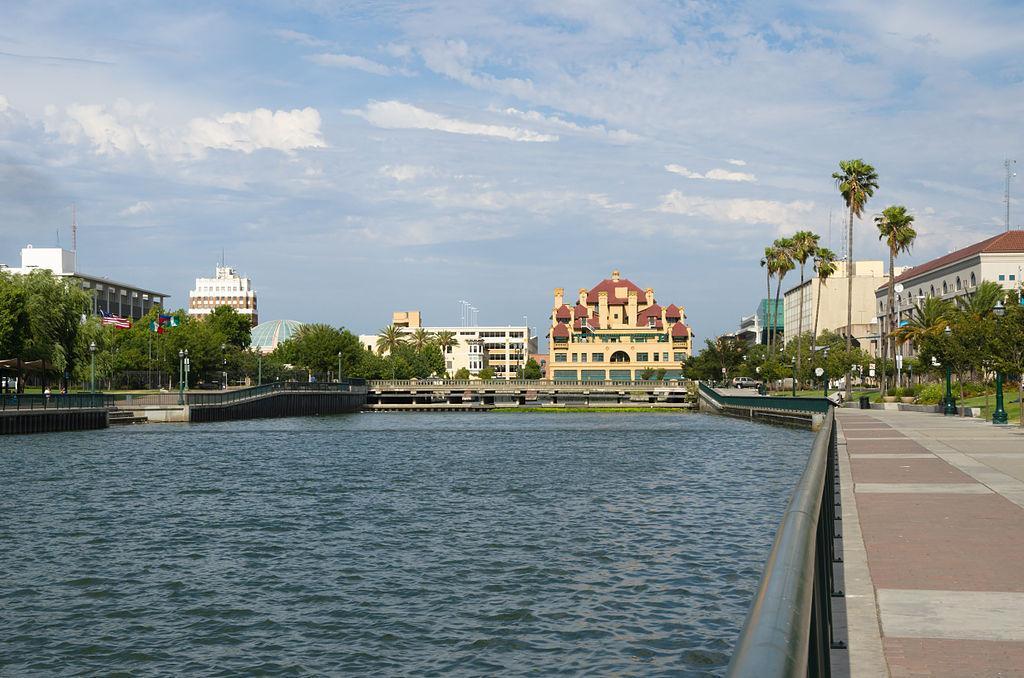
#25. San Joaquin County
– Population: 751,615
– Born in California: 490,005 (65.2% of population)
– Born in a different state: 79,111 (10.5% of population)
— Midwest (2.8%), Northeast (1.5%), South (3.4%), West (2.8%)
– Born in another country: 172,981 (23.01% of population)
— Africa (0.40%) , Asia (9.52%), Europe (0.76%), Latin America (11.75%), North America (0.15%), Oceania (0.43%)
Canva
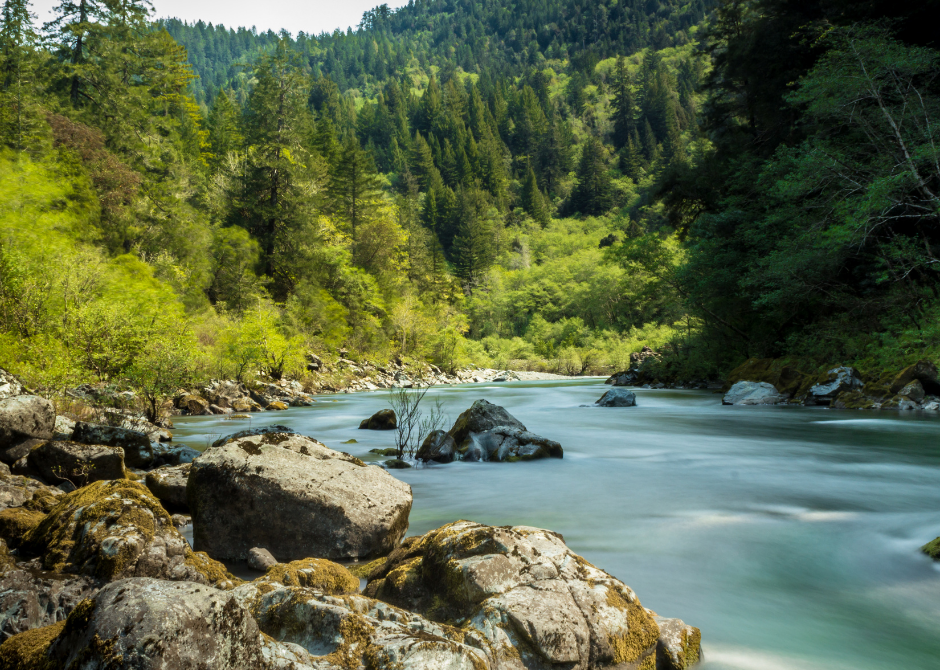
#24. Del Norte County
– Population: 27,692
– Born in California: 18,221 (65.8% of population)
– Born in a different state: 6,939 (25.1% of population)
— Midwest (4.5%), Northeast (2.6%), South (4.8%), West (13.2%)
– Born in another country: 2,228 (8.05% of population)
— Africa (0.07%) , Asia (2.57%), Europe (1.31%), Latin America (3.89%), North America (0.11%), Oceania (0.09%)
You may also like: Most popular baby names for boys of the last decade in California
Binksternet // Wikimedia Commons
#23. Mendocino County
– Population: 87,110
– Born in California: 57,932 (66.5% of population)
– Born in a different state: 17,614 (20.2% of population)
— Midwest (6.3%), Northeast (4.8%), South (3.6%), West (5.5%)
– Born in another country: 10,675 (12.25% of population)
— Africa (0.09%) , Asia (1.53%), Europe (1.04%), Latin America (9.37%), North America (0.16%), Oceania (0.06%)
nickchapman // Wikicommons
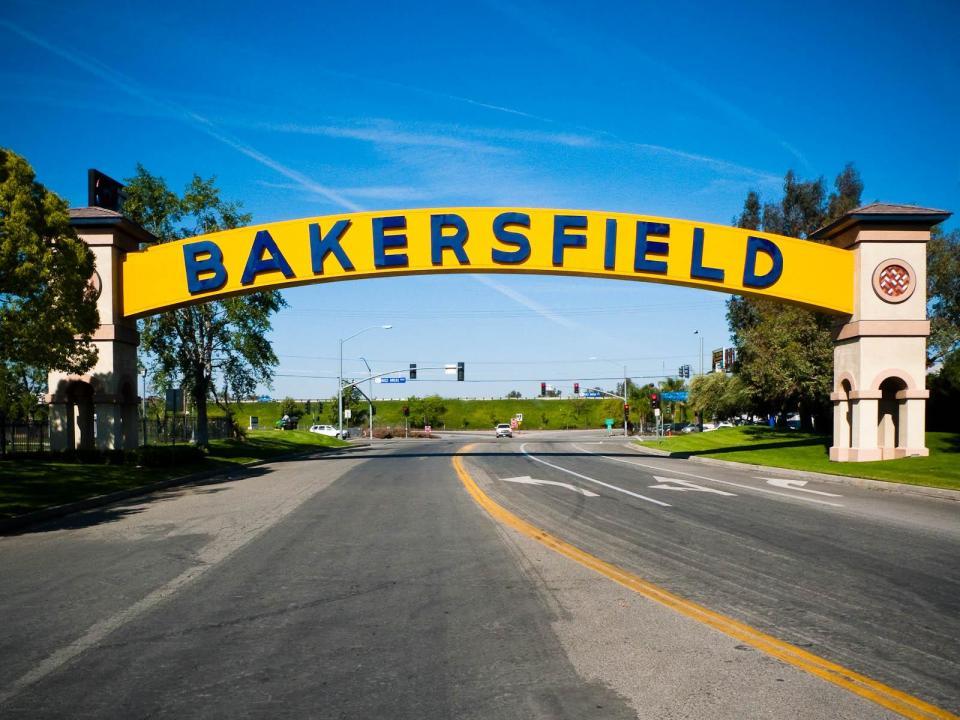
#22. Kern County
– Population: 892,458
– Born in California: 599,375 (67.2% of population)
– Born in a different state: 109,384 (12.3% of population)
— Midwest (3.1%), Northeast (1.5%), South (4.6%), West (3.0%)
– Born in another country: 176,463 (19.77% of population)
— Africa (0.19%) , Asia (3.52%), Europe (0.36%), Latin America (15.48%), North America (0.17%), Oceania (0.06%)
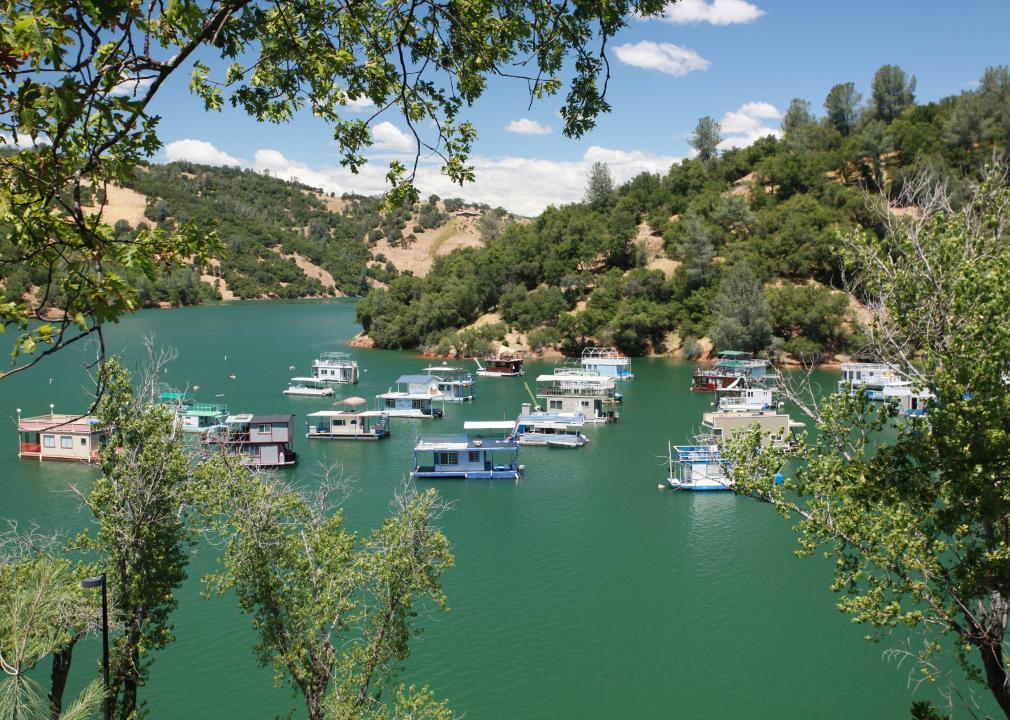
U.S. Army Corps of Engineers Sacramento District // Wikimedia Commons
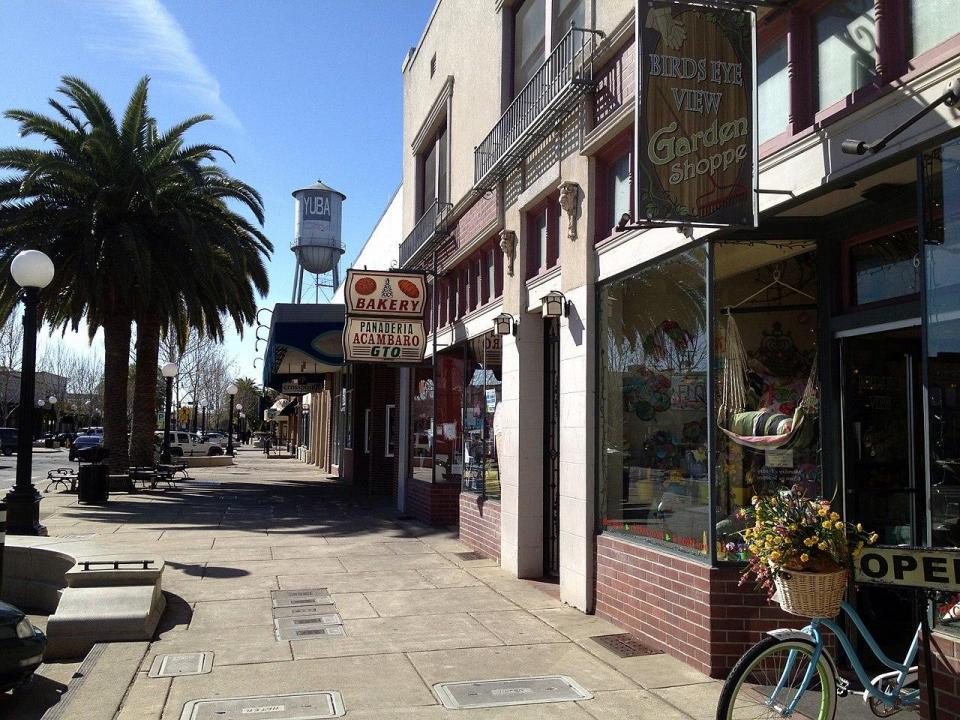
#21. Yuba County
– Population: 77,524
– Born in California: 52,115 (67.2% of population)
– Born in a different state: 14,787 (19.1% of population)
— Midwest (4.2%), Northeast (2.2%), South (6.8%), West (5.8%)
– Born in another country: 9,357 (12.07% of population)
— Africa (0.15%) , Asia (3.57%), Europe (0.64%), Latin America (7.32%), North America (0.30%), Oceania (0.10%)
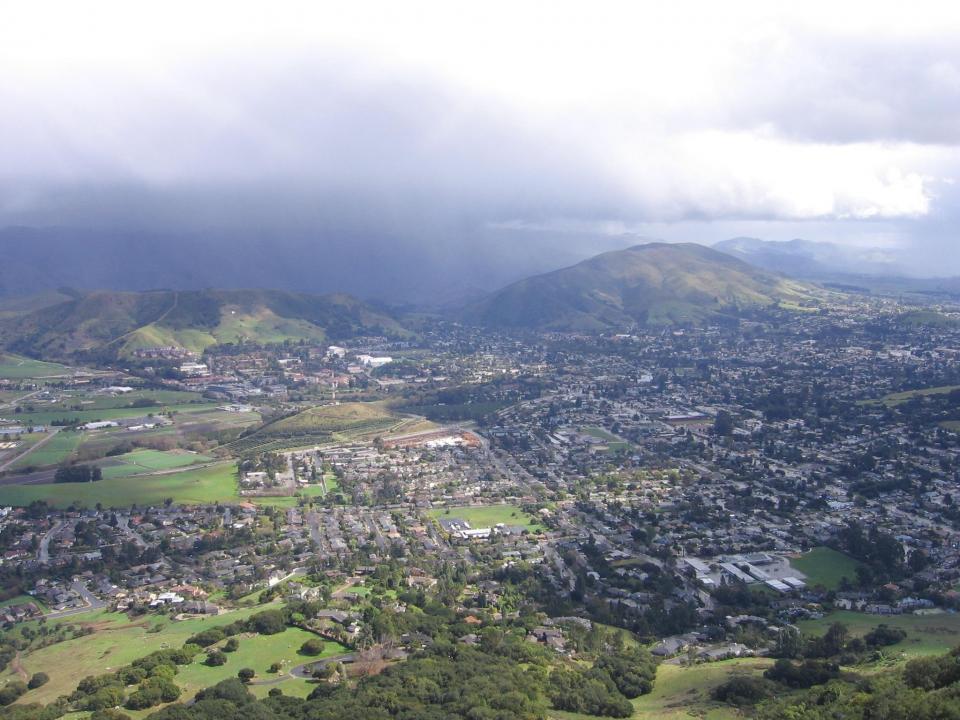
Basar // Wikicommons
#20. San Luis Obispo County
– Population: 282,517
– Born in California: 190,320 (67.4% of population)
– Born in a different state: 60,897 (21.6% of population)
— Midwest (7.3%), Northeast (4.3%), South (4.5%), West (5.4%)
– Born in another country: 26,936 (9.53% of population)
— Africa (0.26%) , Asia (1.86%), Europe (1.33%), Latin America (5.47%), North America (0.54%), Oceania (0.08%)
Public Domain
#19. Madera County
– Population: 155,925
– Born in California: 105,451 (67.6% of population)
– Born in a different state: 17,297 (11.1% of population)
— Midwest (3.0%), Northeast (1.8%), South (3.5%), West (2.8%)
– Born in another country: 31,863 (20.43% of population)
— Africa (0.04%) , Asia (1.66%), Europe (0.57%), Latin America (18.00%), North America (0.16%), Oceania (0.01%)
You may also like: Immigrant farmworkers stand up: A major civil rights moment in California
EPoelzl // Wikimedia Commons
#18. Mariposa County
– Population: 17,319
– Born in California: 11,722 (67.7% of population)
– Born in a different state: 4,476 (25.8% of population)
— Midwest (8.9%), Northeast (4.3%), South (6.9%), West (5.8%)
– Born in another country: 969 (5.60% of population)
— Africa (0.00%) , Asia (1.53%), Europe (1.19%), Latin America (2.80%), North America (0.08%), Oceania (0.00%)
Public Domain
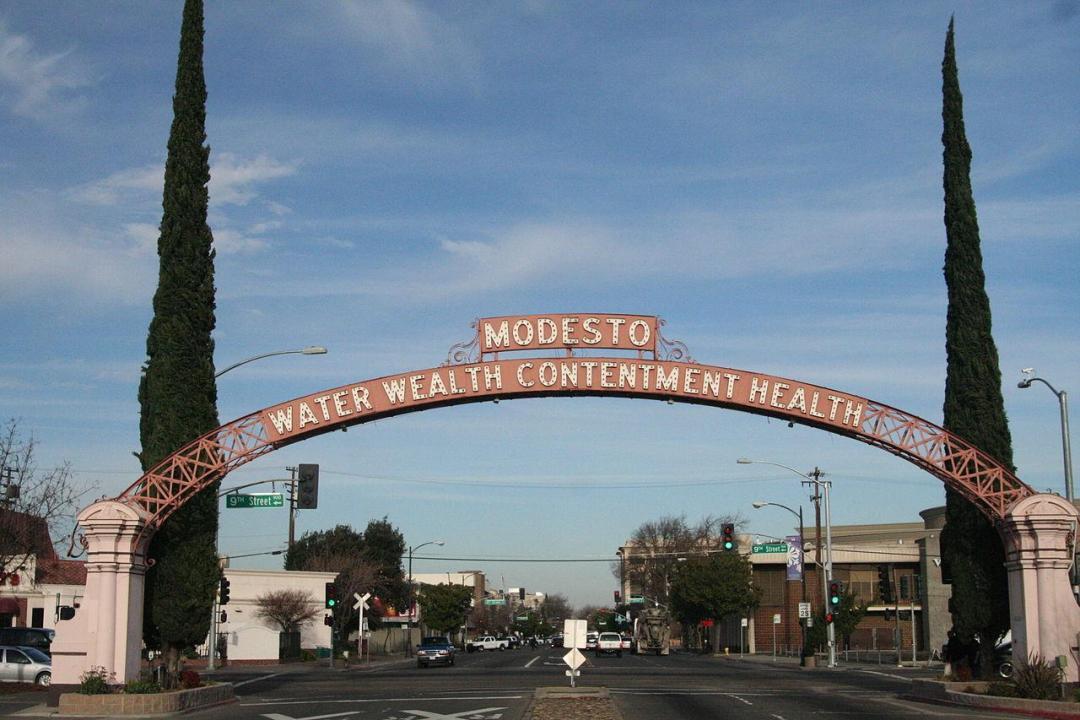
#17. Stanislaus County
– Population: 546,235
– Born in California: 370,607 (67.8% of population)
– Born in a different state: 59,828 (11.0% of population)
— Midwest (3.0%), Northeast (1.4%), South (3.5%), West (3.0%)
– Born in another country: 110,445 (20.22% of population)
— Africa (0.21%) , Asia (4.80%), Europe (1.05%), Latin America (13.45%), North America (0.14%), Oceania (0.57%)
Trance addict // Wikimedia Commons
#16. Glenn County
– Population: 28,060
– Born in California: 19,127 (68.2% of population)
– Born in a different state: 3,592 (12.8% of population)
— Midwest (3.9%), Northeast (2.0%), South (2.9%), West (4.1%)
– Born in another country: 4,983 (17.76% of population)
— Africa (0.02%) , Asia (1.50%), Europe (0.36%), Latin America (15.69%), North America (0.16%), Oceania (0.02%)
David Jordan // Wikicommons
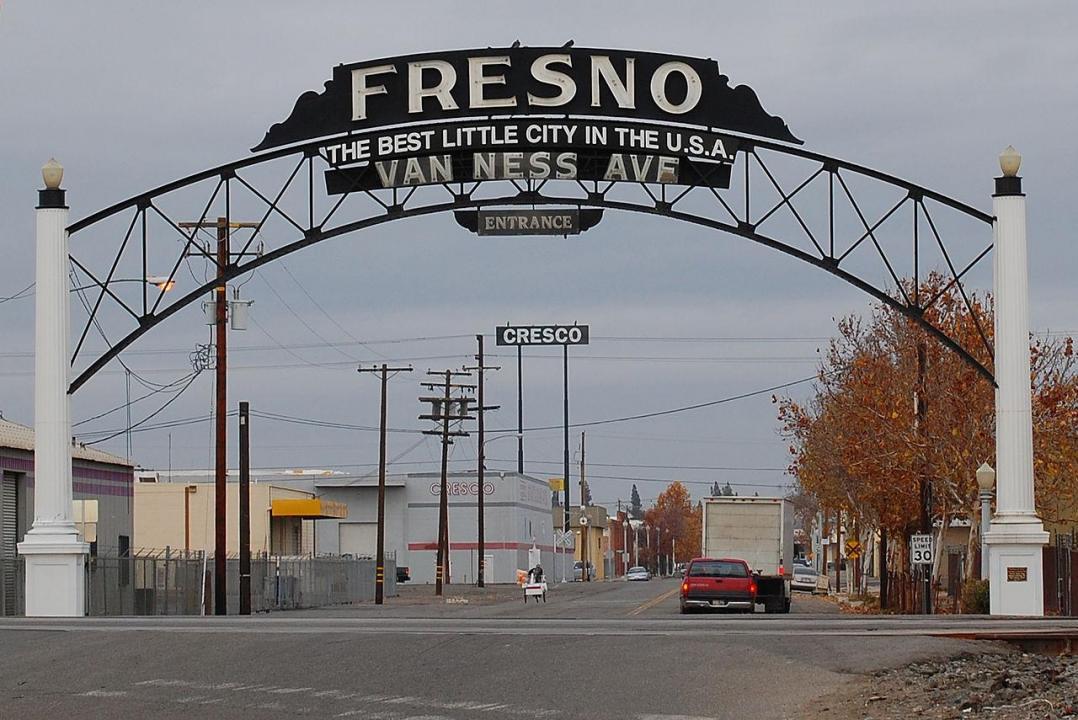
#15. Fresno County
– Population: 990,204
– Born in California: 676,030 (68.3% of population)
– Born in a different state: 102,854 (10.4% of population)
— Midwest (2.6%), Northeast (1.3%), South (3.8%), West (2.8%)
– Born in another country: 201,805 (20.38% of population)
— Africa (0.25%) , Asia (5.93%), Europe (0.58%), Latin America (13.42%), North America (0.14%), Oceania (0.06%)
Canva
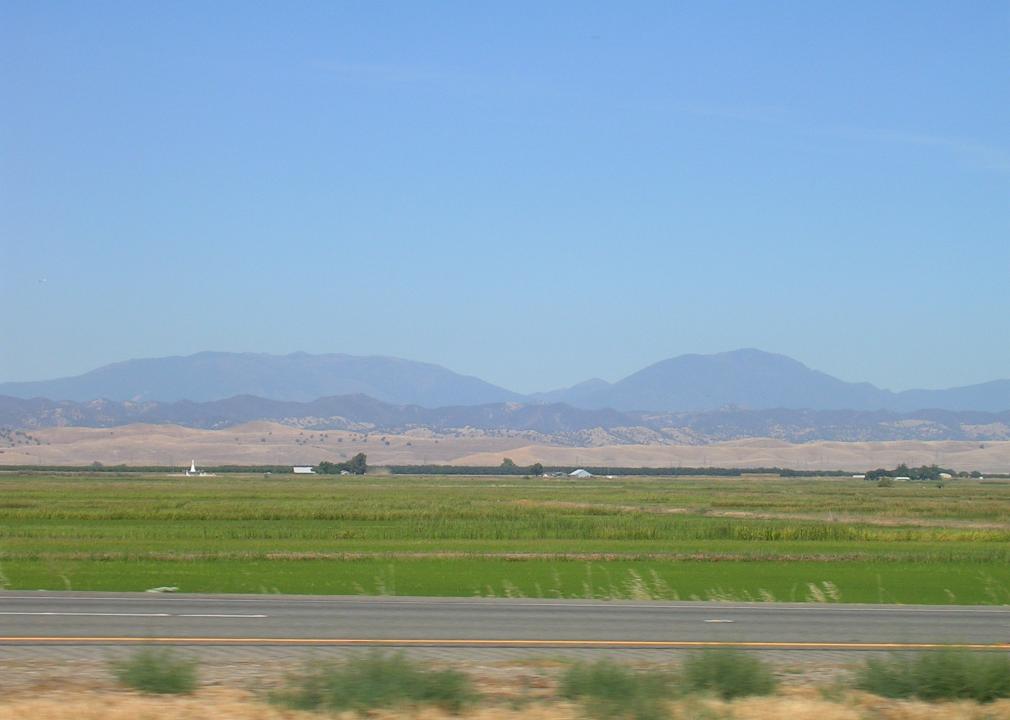
#14. Tulare County
– Population: 463,955
– Born in California: 316,888 (68.3% of population)
– Born in a different state: 42,810 (9.2% of population)
— Midwest (2.2%), Northeast (0.9%), South (3.6%), West (2.4%)
– Born in another country: 99,726 (21.49% of population)
— Africa (0.11%) , Asia (1.77%), Europe (0.59%), Latin America (18.90%), North America (0.08%), Oceania (0.05%)
You may also like: See how much of its wind energy potential California uses
Chuck Abbe // Wikimedia Commons
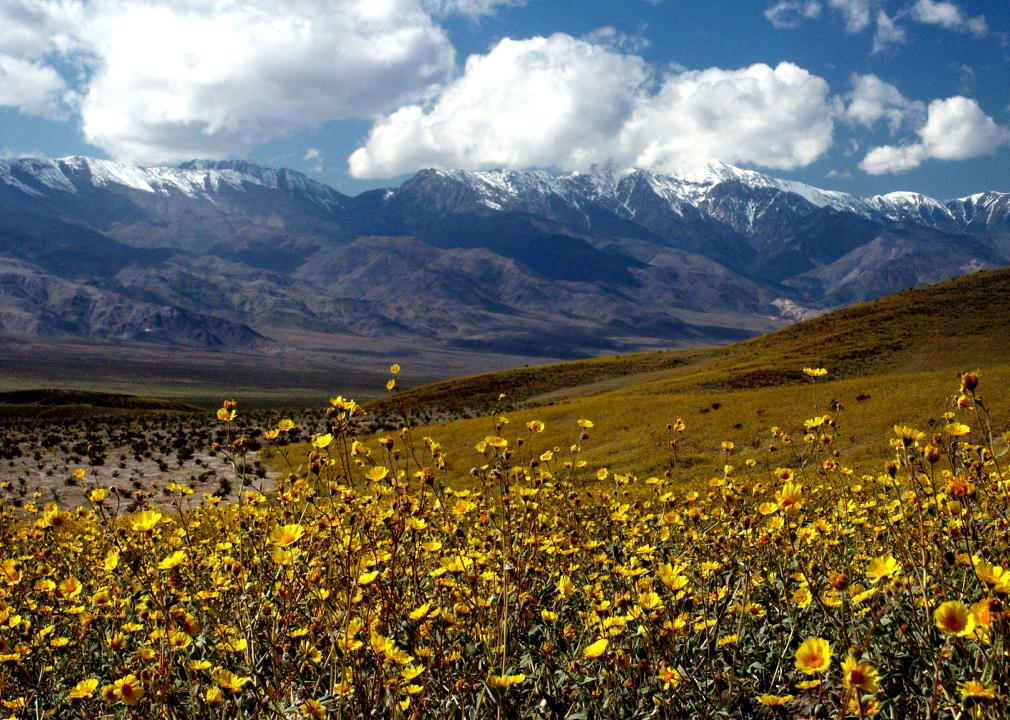
#13. Inyo County
– Population: 17,930
– Born in California: 12,383 (69.1% of population)
– Born in a different state: 4,108 (22.9% of population)
— Midwest (7.9%), Northeast (4.6%), South (2.6%), West (7.7%)
– Born in another country: 1,315 (7.33% of population)
— Africa (0.00%) , Asia (1.05%), Europe (0.61%), Latin America (5.11%), North America (0.47%), Oceania (0.08%)
Kenneth Green // Wikimedia Commons
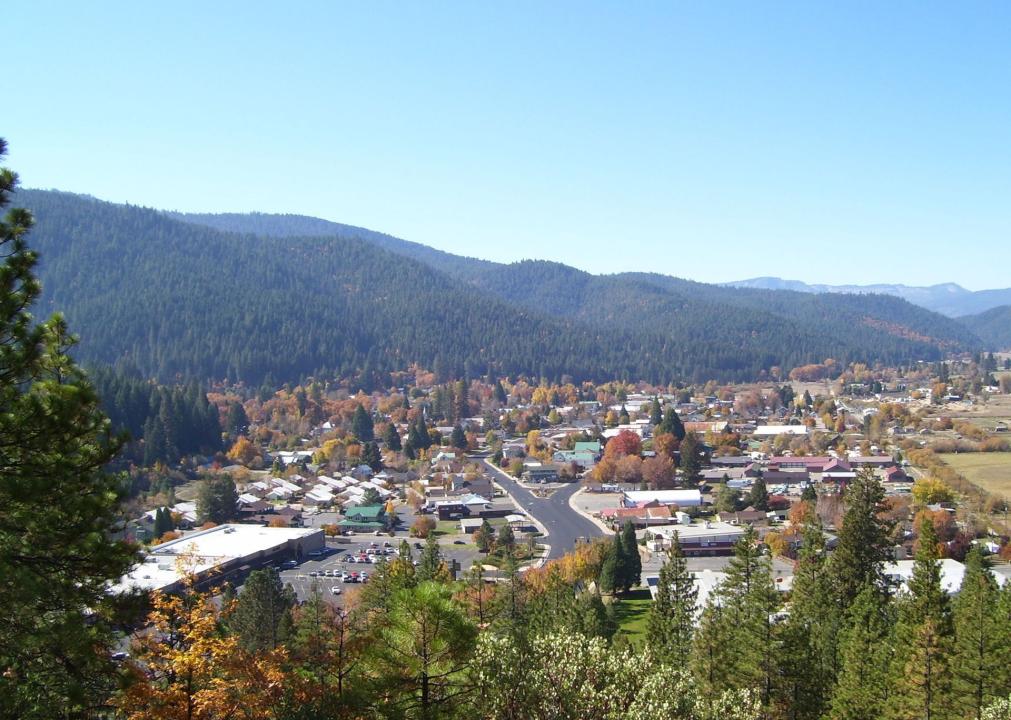
#12. Plumas County
– Population: 18,844
– Born in California: 13,047 (69.2% of population)
– Born in a different state: 4,926 (26.1% of population)
— Midwest (7.3%), Northeast (2.8%), South (4.8%), West (11.2%)
– Born in another country: 746 (3.96% of population)
— Africa (0.00%) , Asia (1.28%), Europe (0.81%), Latin America (1.26%), North America (0.37%), Oceania (0.24%)
![]()
CFang // Wikimedia Commons
#11. Lake County
– Population: 64,276
– Born in California: 44,999 (70.0% of population)
– Born in a different state: 13,463 (20.9% of population)
— Midwest (6.4%), Northeast (3.9%), South (5.4%), West (5.3%)
– Born in another country: 5,256 (8.18% of population)
— Africa (0.05%) , Asia (1.50%), Europe (0.69%), Latin America (5.60%), North America (0.25%), Oceania (0.09%)
Almonroth // Wikimedia Commons
#10. Trinity County
– Population: 12,541
– Born in California: 8,781 (70.0% of population)
– Born in a different state: 3,335 (26.6% of population)
— Midwest (6.7%), Northeast (4.7%), South (6.1%), West (9.0%)
– Born in another country: 390 (3.11% of population)
— Africa (0.09%) , Asia (1.04%), Europe (0.68%), Latin America (1.13%), North America (0.18%), Oceania (0.00%)
Michael Patrick // Wikimedia Commons
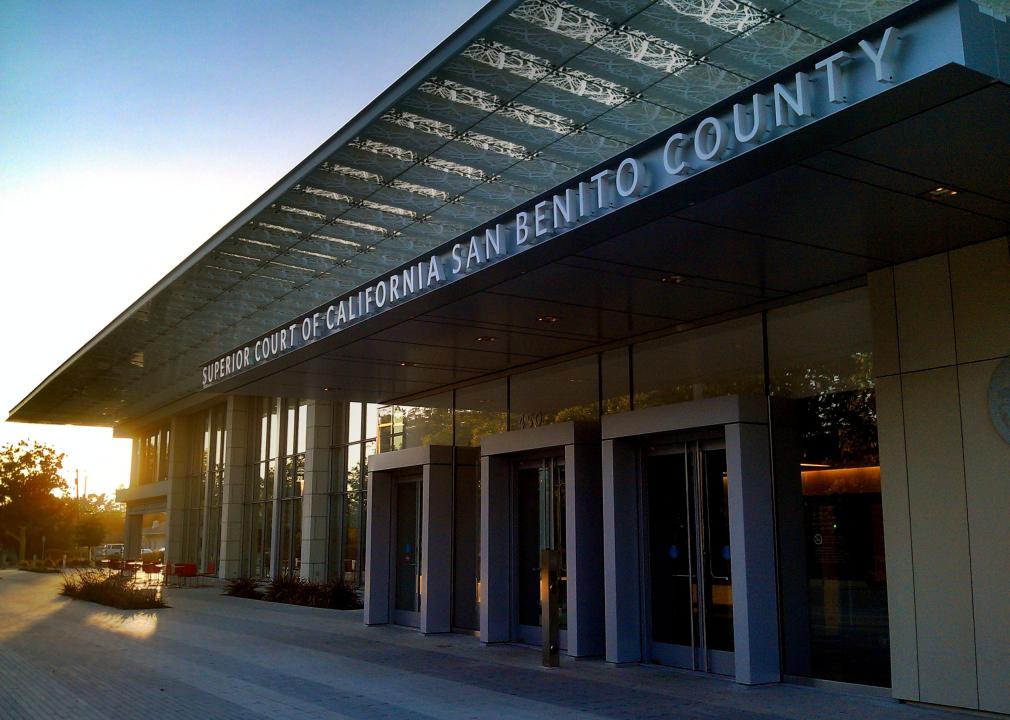
#9. San Benito County
– Population: 61,547
– Born in California: 43,247 (70.3% of population)
– Born in a different state: 6,150 (10.0% of population)
— Midwest (2.5%), Northeast (1.9%), South (3.1%), West (2.5%)
– Born in another country: 11,489 (18.67% of population)
— Africa (0.32%) , Asia (1.70%), Europe (1.09%), Latin America (15.35%), North America (0.15%), Oceania (0.05%)
You may also like: Highest-rated things to do in California, according to Tripadvisor
Doug Kerr // Wikicommons
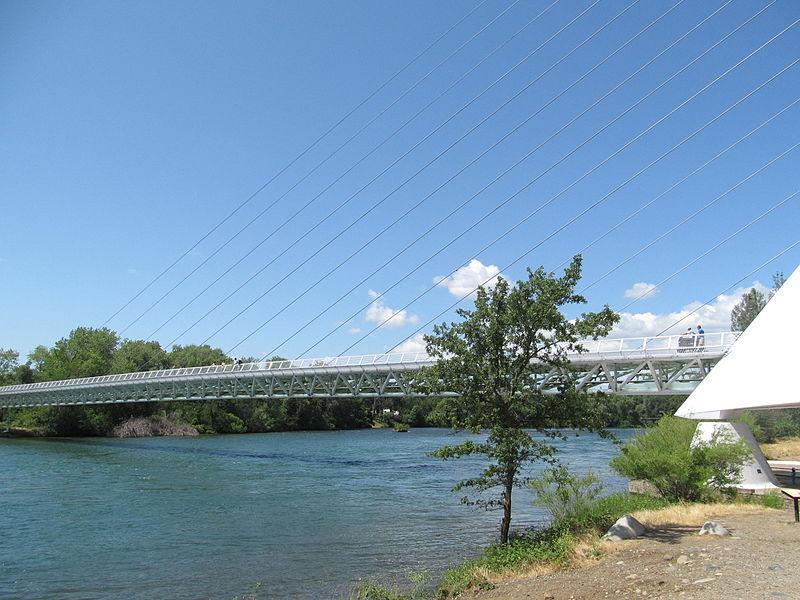
#8. Shasta County
– Population: 179,267
– Born in California: 126,374 (70.5% of population)
– Born in a different state: 41,238 (23.0% of population)
— Midwest (6.6%), Northeast (2.8%), South (5.2%), West (8.4%)
– Born in another country: 10,271 (5.73% of population)
— Africa (0.16%) , Asia (2.08%), Europe (1.13%), Latin America (2.08%), North America (0.25%), Oceania (0.03%)
Cory Maylett // Wikimedia Commons
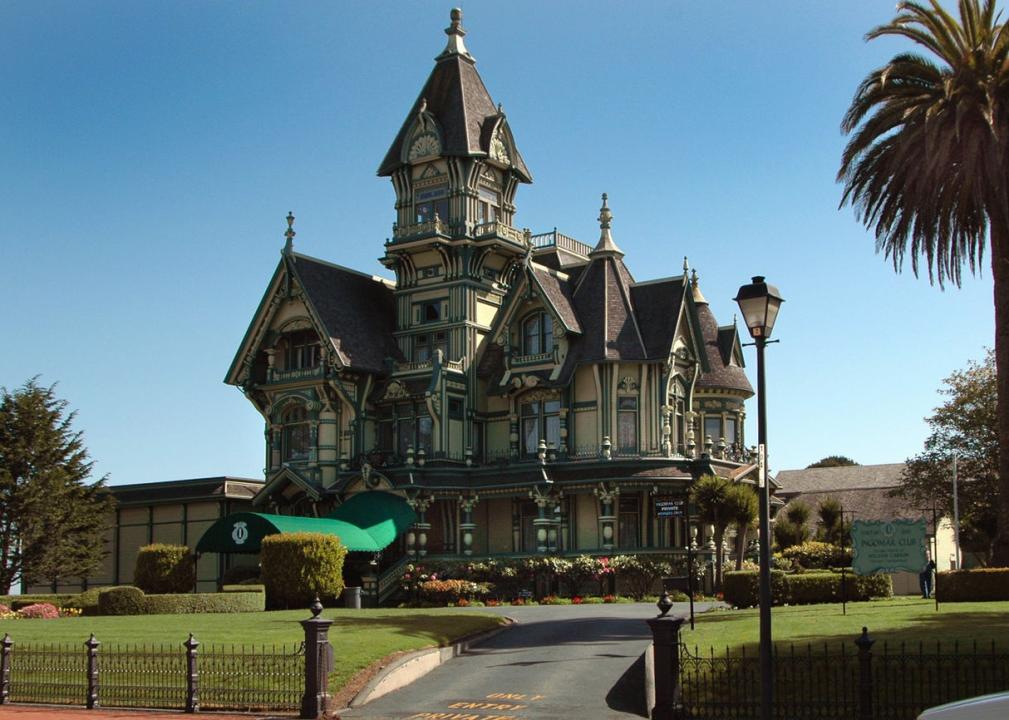
#7. Humboldt County
– Population: 136,101
– Born in California: 96,289 (70.7% of population)
– Born in a different state: 31,103 (22.9% of population)
— Midwest (6.0%), Northeast (3.8%), South (5.0%), West (8.1%)
– Born in another country: 7,376 (5.42% of population)
— Africa (0.06%) , Asia (1.62%), Europe (0.79%), Latin America (2.45%), North America (0.35%), Oceania (0.15%)
Canva
#6. Butte County
– Population: 223,344
– Born in California: 160,628 (71.9% of population)
– Born in a different state: 43,171 (19.3% of population)
— Midwest (5.1%), Northeast (2.9%), South (4.6%), West (6.7%)
– Born in another country: 16,798 (7.52% of population)
— Africa (0.09%) , Asia (2.48%), Europe (0.86%), Latin America (3.65%), North America (0.35%), Oceania (0.09%)
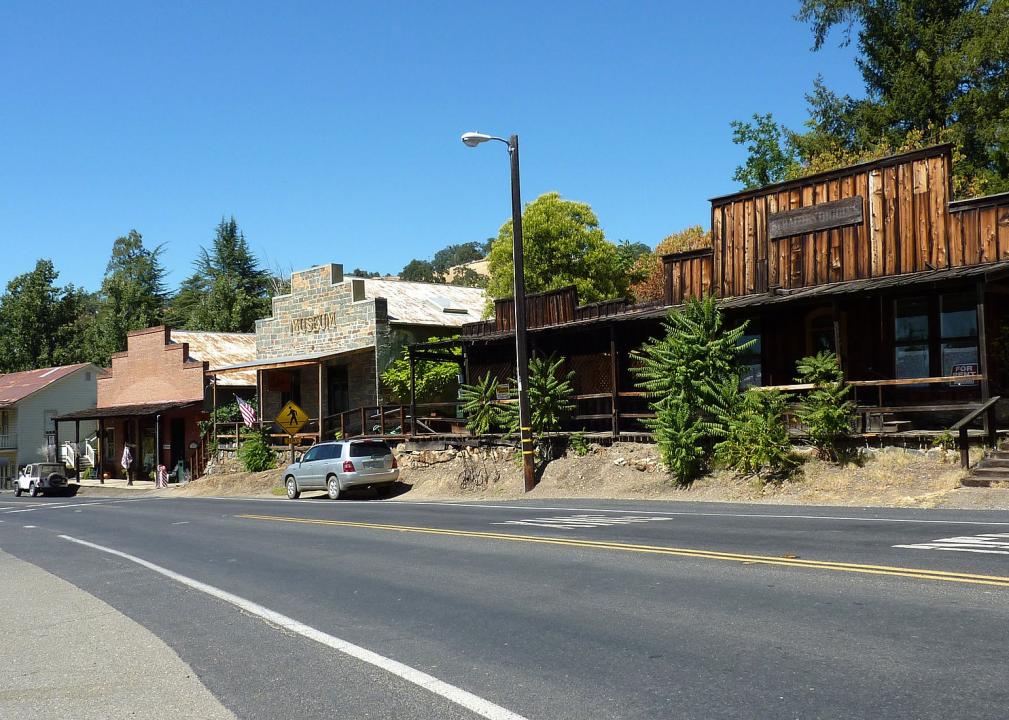
Bobak Ha’Eri // Wikimedia Commons
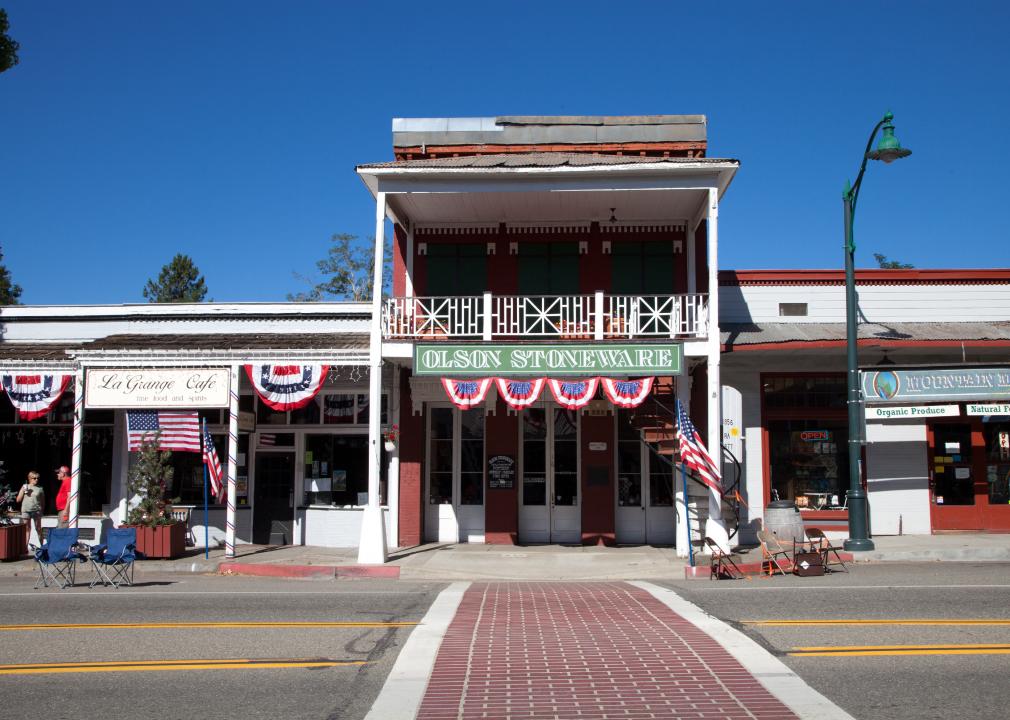
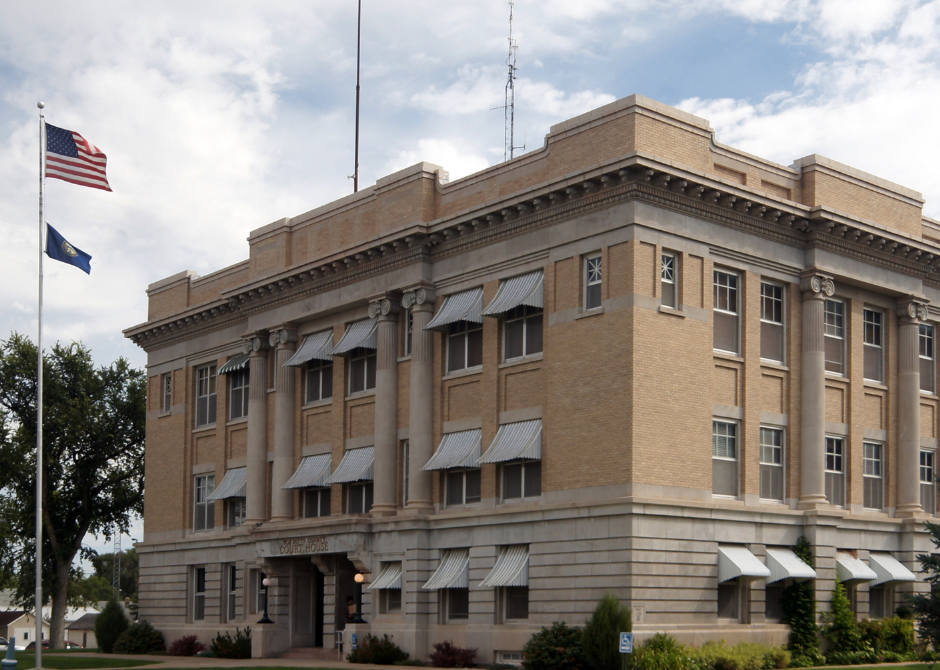
#5. Amador County
– Population: 39,023
– Born in California: 28,305 (72.5% of population)
– Born in a different state: 8,263 (21.2% of population)
— Midwest (6.3%), Northeast (3.9%), South (5.0%), West (6.1%)
– Born in another country: 2,291 (5.87% of population)
— Africa (0.00%) , Asia (1.05%), Europe (1.58%), Latin America (2.88%), North America (0.19%), Oceania (0.17%)
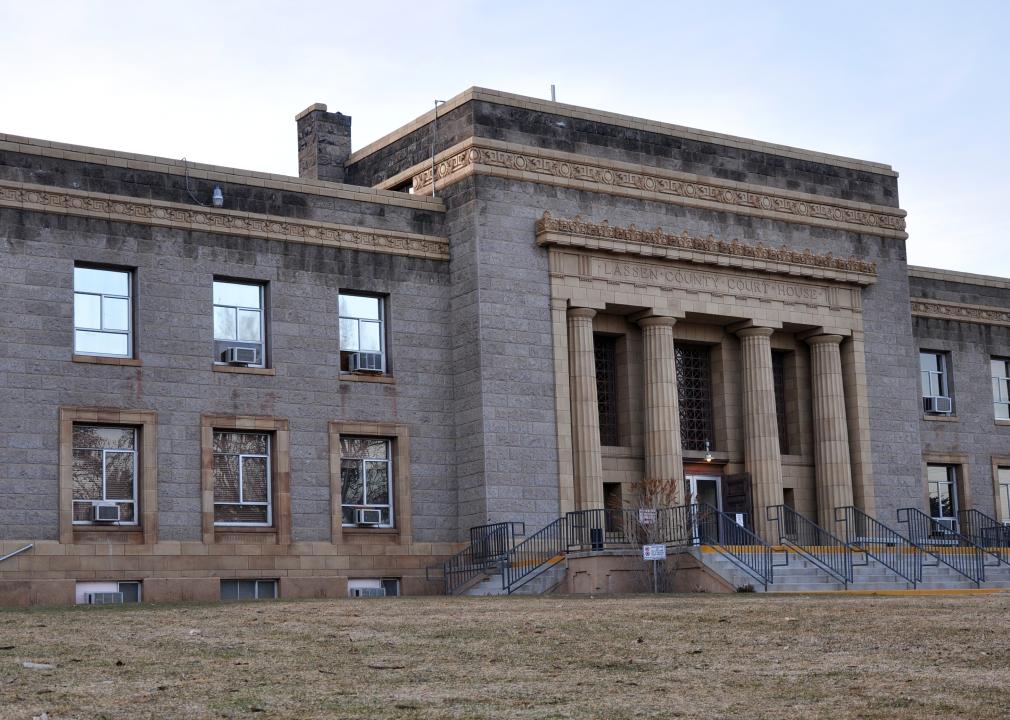
Finetooth // Wikimedia Commons
#4. Lassen County
– Population: 30,600
– Born in California: 22,427 (73.3% of population)
– Born in a different state: 6,240 (20.4% of population)
— Midwest (4.3%), Northeast (1.9%), South (3.8%), West (10.3%)
– Born in another country: 1,632 (5.33% of population)
— Africa (0.09%) , Asia (1.10%), Europe (0.36%), Latin America (3.33%), North America (0.05%), Oceania (0.40%)
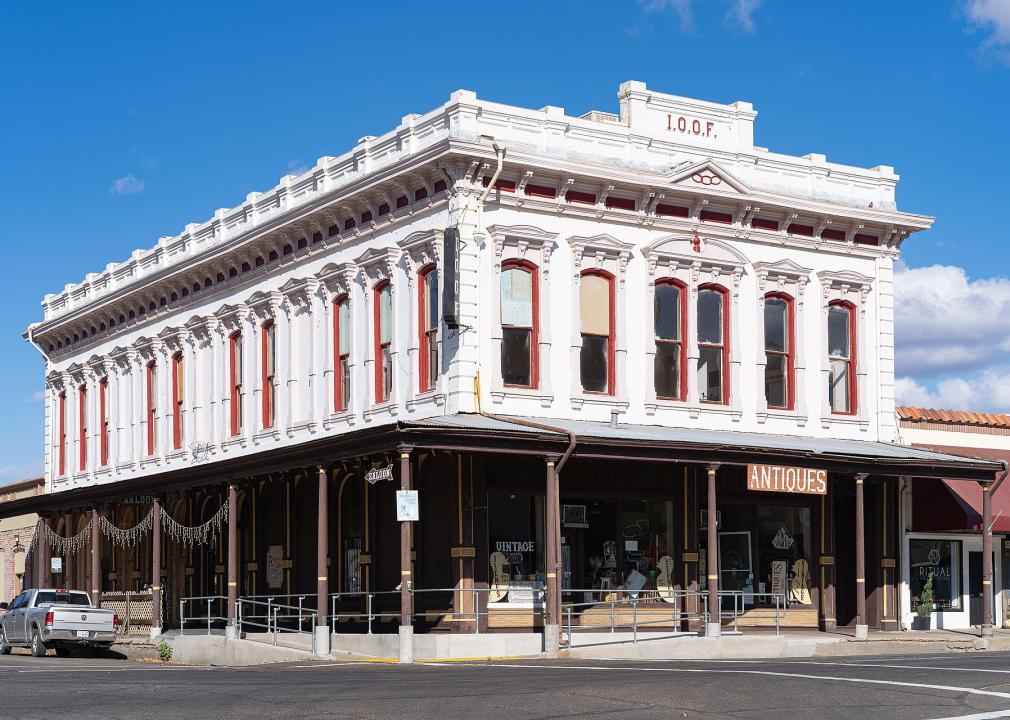
Frank Schulenburg // Wikimedia Commons
#3. Tehama County
– Population: 64,176
– Born in California: 47,422 (73.9% of population)
– Born in a different state: 10,720 (16.7% of population)
— Midwest (4.7%), Northeast (2.0%), South (3.9%), West (6.1%)
– Born in another country: 5,614 (8.75% of population)
— Africa (0.12%) , Asia (1.01%), Europe (0.42%), Latin America (7.11%), North America (0.09%), Oceania (0.01%)
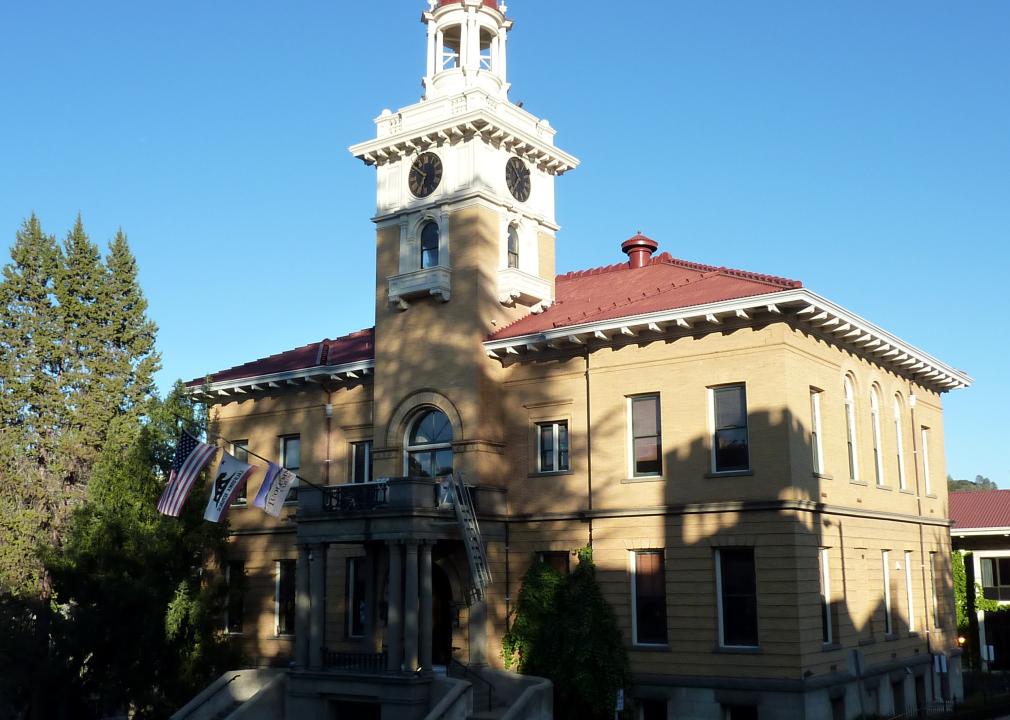
Bobak Ha’Eri // Wikimedia Commons
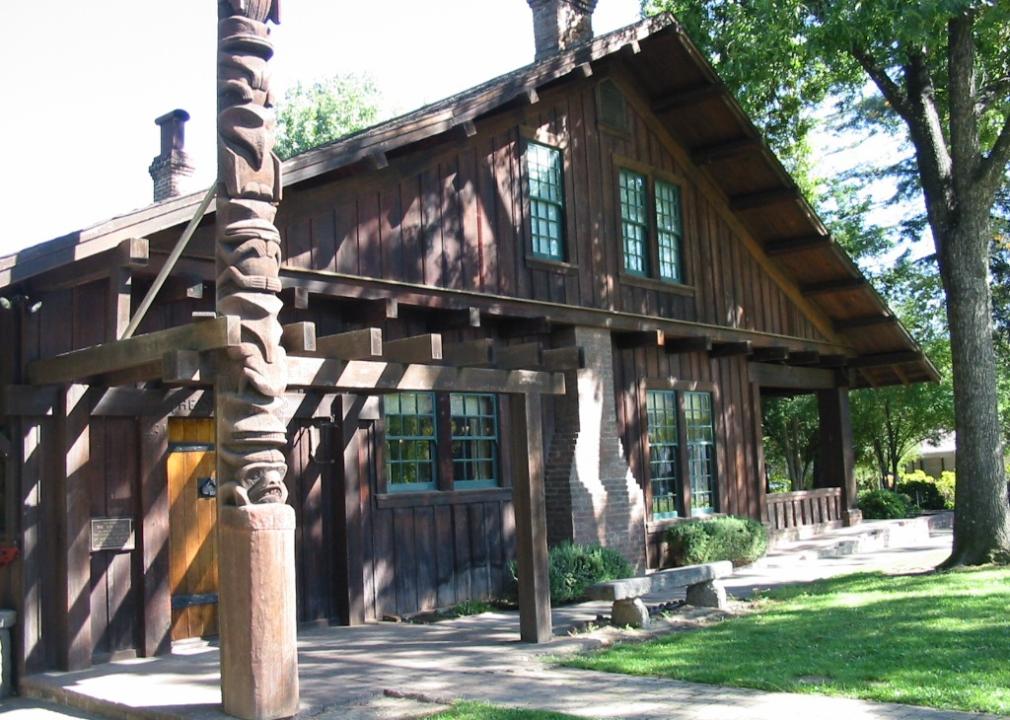
#2. Tuolumne County
– Population: 54,147
– Born in California: 40,114 (74.1% of population)
– Born in a different state: 11,097 (20.5% of population)
— Midwest (5.7%), Northeast (3.3%), South (5.6%), West (6.0%)
– Born in another country: 2,565 (4.74% of population)
— Africa (0.25%) , Asia (1.09%), Europe (1.05%), Latin America (1.78%), North America (0.55%), Oceania (0.01%)

Canva
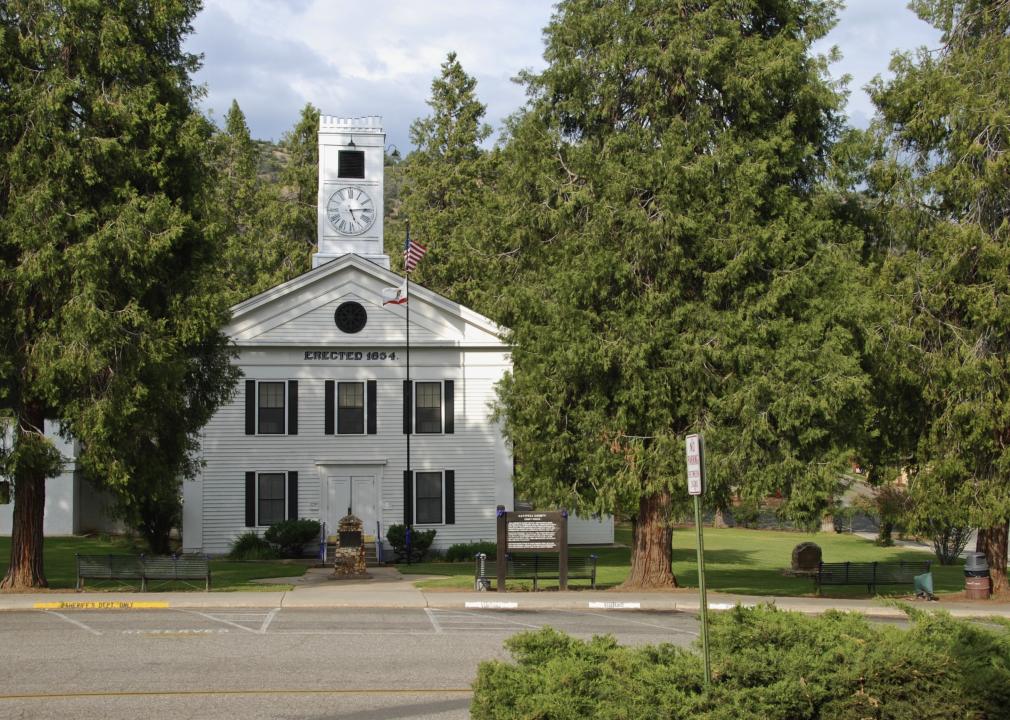
#1. Calaveras County
– Population: 45,828
– Born in California: 34,719 (75.8% of population)
– Born in a different state: 8,825 (19.3% of population)
— Midwest (6.1%), Northeast (2.8%), South (5.4%), West (5.0%)
– Born in another country: 1,983 (4.33% of population)
— Africa (0.08%) , Asia (1.17%), Europe (1.35%), Latin America (1.25%), North America (0.38%), Oceania (0.10%)