Counties with the lowest hospital bed capacity in Arizona

Ken Lund // Flickr
Counties with the lowest hospital bed capacity in Arizona
The vaccine deployment in December 2020 signaled a turning point in the COVID-19 pandemic. By the end of May 2021, 40% of the U.S. population was fully vaccinated. But as vaccination rates lagged over the summer, new surges of COVID-19 came, including Delta in the summer of 2021, and now the Omicron variant, which comprises the majority of cases in the U.S.
Researchers around the world have reported that Omicron is more transmissible than Delta, making breakthrough and repeat infections more likely. Early research suggests this strain may cause less severe illness than Delta and the original virus, however, health officials have warned an Omicron-driven surge could still increase hospitalization and death rates—especially in areas with less vaccinated populations.
The United States as of Feb. 24 reached 942,985 COVID-19-related deaths and nearly 78.7 million COVID-19 cases, according to Johns Hopkins University. Currently, 64.8% of the population is fully vaccinated, and 43.4% have received booster doses.
Stacker compiled a list of the counties with the lowest in-patient bed capacity in Arizona using data from the U.S. Department of Health & Human Services and vaccination data from Covid Act Now. Counties are ranked by the percent of in-patient hospital beds filled as of Feb. 23, with the percent of hospital beds filled by COVID-19 patients serving as a tiebreaker. Hospitalization data was available for about 77% of counties in the U.S. Keep reading to see what hospital capacity looks like in your county.
![]()

United States Bureau of Land Management // Wikimedia Commons
#14. La Paz County, AZ
– Inpatient beds occupied: 20.0% (5.0% by COVID-19 patients)
— 76.2% more availability than Arizona overall
– ICU beds occupied: 67.0% (33.0% by COVID-19 patients)
— 18.3% more availability than Arizona overall
– Cases per 100k in last 7 days: 171 (36 cases)
– Population that is fully vaccinated: 47.6% (10,050 fully vaccinated)
— -20.5% lower vaccination rate than Arizona

Andreas F. Borchert // Wikimedia Commons
#13. Apache County, AZ
– Inpatient beds occupied: 37.0% (9.0% by COVID-19 patients)
— 56.0% more availability than Arizona overall
– ICU beds occupied: 54.0% (14.0% by COVID-19 patients)
— 34.1% more availability than Arizona overall
– Cases per 100k in last 7 days: 366 (263 cases)
– Population that is fully vaccinated: 95.0% (72,052 fully vaccinated)
— 58.6% higher vaccination rate than Arizona
Clay Gilliland // Flickr
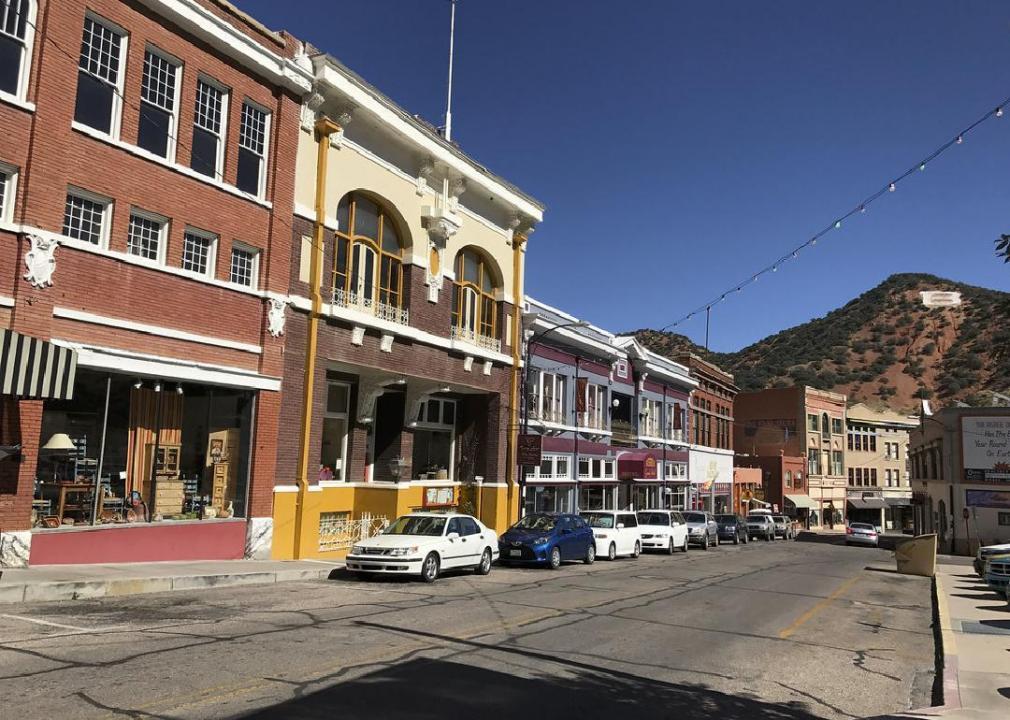
#12. Cochise County, AZ
– Inpatient beds occupied: 41.0% (6.0% by COVID-19 patients)
— 51.2% more availability than Arizona overall
– ICU beds occupied: 71.0% (17.0% by COVID-19 patients)
— 13.4% more availability than Arizona overall
– Cases per 100k in last 7 days: 291 (367 cases)
– Population that is fully vaccinated: 62.9% (79,229 fully vaccinated)
— 5.0% higher vaccination rate than Arizona

Elnogalense // Wikimedia Commons
#11. Santa Cruz County, AZ
– Inpatient beds occupied: 44.0% (1.0% by COVID-19 patients)
— 47.6% more availability than Arizona overall
– ICU beds occupied: data not available
— 82% full in Arizona overall
– Cases per 100k in last 7 days: 135 (63 cases)
– Population that is fully vaccinated: 80.5% (37,441 fully vaccinated)
— 34.4% higher vaccination rate than Arizona
Alan Levine // Wikimedia Commons
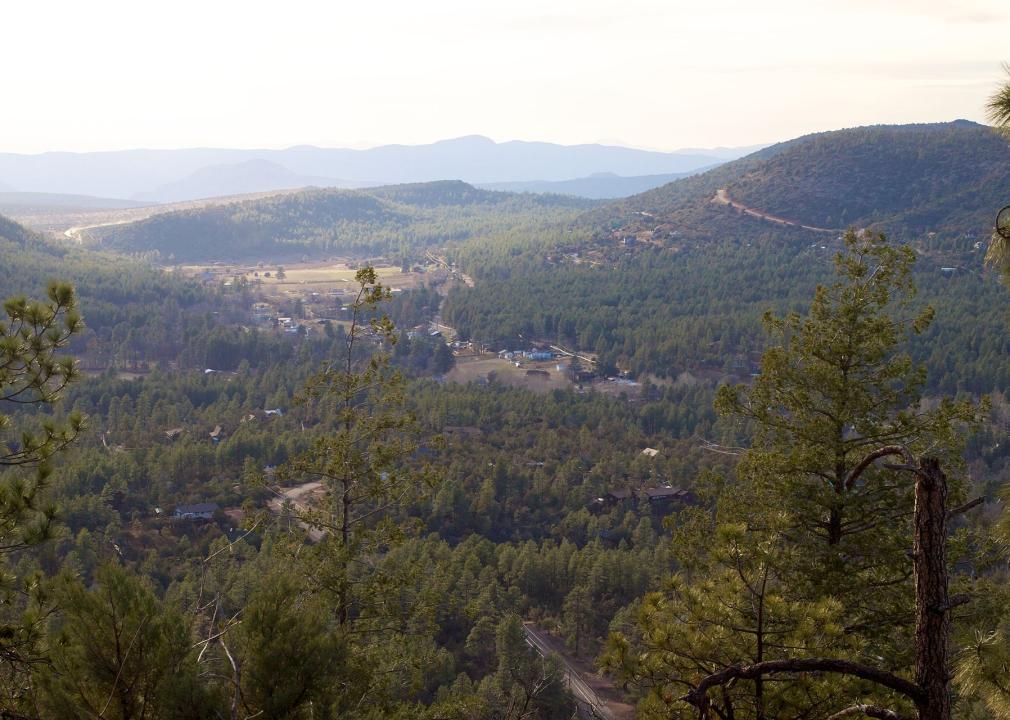
#10. Gila County, AZ
– Inpatient beds occupied: 48.0% (9.0% by COVID-19 patients)
— 42.9% more availability than Arizona overall
– ICU beds occupied: 68.0% (14.0% by COVID-19 patients)
— 17.1% more availability than Arizona overall
– Cases per 100k in last 7 days: 313 (169 cases)
– Population that is fully vaccinated: 58.2% (31,415 fully vaccinated)
— -2.8% lower vaccination rate than Arizona

Wars // Wikimedia Commons
#9. Graham County, AZ
– Inpatient beds occupied: 57.0% (3.0% by COVID-19 patients)
— 32.1% more availability than Arizona overall
– ICU beds occupied: 31.0% (0.0% by COVID-19 patients)
— 62.2% more availability than Arizona overall
– Cases per 100k in last 7 days: 247 (96 cases)
– Population that is fully vaccinated: 62.3% (24,205 fully vaccinated)
— 4.0% higher vaccination rate than Arizona
Ixnayonthetimmay // Wikimedia Commons
#8. Navajo County, AZ
– Inpatient beds occupied: 58.0% (14.0% by COVID-19 patients)
— 31.0% more availability than Arizona overall
– ICU beds occupied: 100.0% (48.0% by COVID-19 patients)
— 22.0% more full than Arizona overall
– Cases per 100k in last 7 days: 311 (345 cases)
– Population that is fully vaccinated: 75.5% (83,791 fully vaccinated)
— 26.0% higher vaccination rate than Arizona

InSapphoWeTrust // Wikicommons
#7. Mohave County, AZ
– Inpatient beds occupied: 61.0% (14.0% by COVID-19 patients)
— 27.4% more availability than Arizona overall
– ICU beds occupied: 66.0% (33.0% by COVID-19 patients)
— 19.5% more availability than Arizona overall
– Cases per 100k in last 7 days: 196 (416 cases)
– Population that is fully vaccinated: 40.7% (86,377 fully vaccinated)
— -32.1% lower vaccination rate than Arizona

zeesstof // Wikimedia Commons
#6. Pinal County, AZ
– Inpatient beds occupied: 72.0% (11.0% by COVID-19 patients)
— 14.3% more availability than Arizona overall
– ICU beds occupied: 65.0% (16.0% by COVID-19 patients)
— 20.7% more availability than Arizona overall
– Cases per 100k in last 7 days: 231 (1,067 cases)
– Population that is fully vaccinated: 52.5% (242,943 fully vaccinated)
— -12.4% lower vaccination rate than Arizona

HildaWeges Photography // Shutterstock
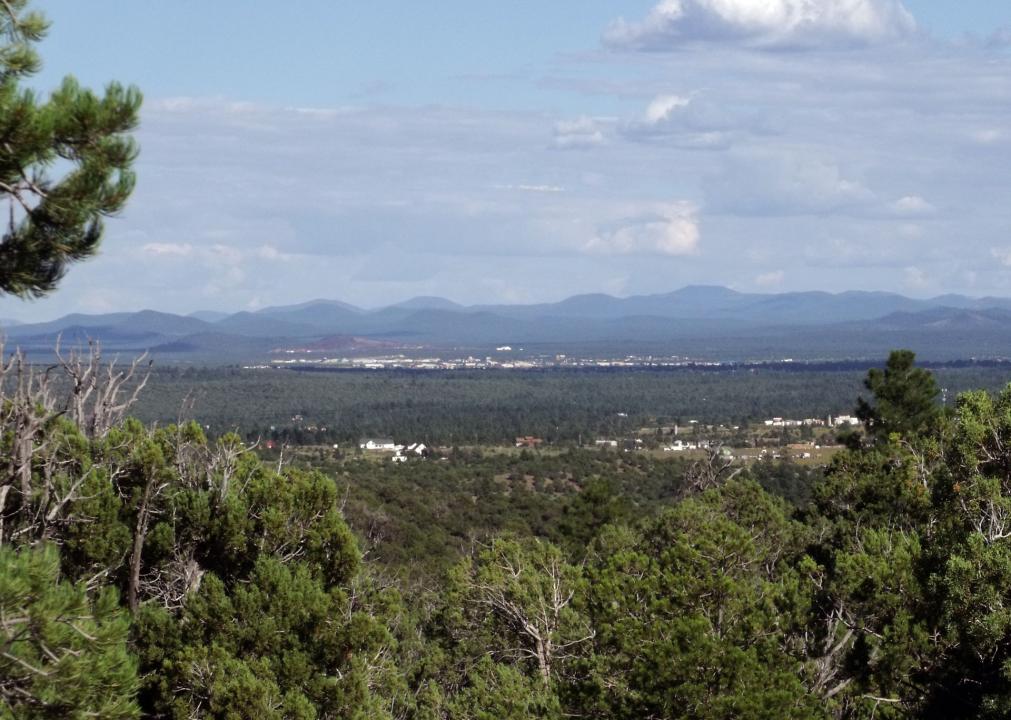
#5. Coconino County, AZ
– Inpatient beds occupied: 76.0% (14.0% by COVID-19 patients)
— 9.5% more availability than Arizona overall
– ICU beds occupied: 83.0% (26.0% by COVID-19 patients)
— 1.2% more full than Arizona overall
– Cases per 100k in last 7 days: 214 (307 cases)
– Population that is fully vaccinated: 75.7% (108,613 fully vaccinated)
— 26.4% higher vaccination rate than Arizona

Sean Pavone // Shutterstock
#4. Maricopa County, AZ
– Inpatient beds occupied: 78.0% (9.0% by COVID-19 patients)
— 7.1% more availability than Arizona overall
– ICU beds occupied: 72.0% (15.0% by COVID-19 patients)
— 12.2% more availability than Arizona overall
– Cases per 100k in last 7 days: 201 (9,035 cases)
– Population that is fully vaccinated: 56.0% (2,511,387 fully vaccinated)
— -6.5% lower vaccination rate than Arizona

Jay Yuan // Shutterstock
#3. Pima County, AZ
– Inpatient beds occupied: 87.0% (10.0% by COVID-19 patients)
— 3.6% more full than Arizona overall
– ICU beds occupied: 72.0% (19.0% by COVID-19 patients)
— 12.2% more availability than Arizona overall
– Cases per 100k in last 7 days: 242 (2,531 cases)
– Population that is fully vaccinated: 67.2% (703,698 fully vaccinated)
— 12.2% higher vaccination rate than Arizona

Martha.baden // Wikimedia
#2. Yavapai County, AZ
– Inpatient beds occupied: 90.0% (25.0% by COVID-19 patients)
— 7.1% more full than Arizona overall
– ICU beds occupied: 75.0% (15.0% by COVID-19 patients)
— 8.5% more availability than Arizona overall
– Cases per 100k in last 7 days: 172 (405 cases)
– Population that is fully vaccinated: 46.0% (108,051 fully vaccinated)
— -23.2% lower vaccination rate than Arizona

Ken Lund // Flickr
#1. Yuma County, AZ
– Inpatient beds occupied: 100.0% (23.0% by COVID-19 patients)
— 19.0% more full than Arizona overall
– ICU beds occupied: 65.0% (30.0% by COVID-19 patients)
— 20.7% more availability than Arizona overall
– Cases per 100k in last 7 days: 192 (410 cases)
– Population that is fully vaccinated: 67.8% (144,966 fully vaccinated)
— 13.2% higher vaccination rate than Arizona