Counties with the highest COVID-19 vaccination rate in Arizona

Andreas F. Borchert // Wikimedia Commons
Counties with the highest COVID-19 vaccination rate in Arizona
The vaccine deployment in December 2020 signaled a turning point in the COVID-19 pandemic. By the end of May 2021, 40% of the U.S. population was fully vaccinated. But as vaccination rates lagged over the summer, new surges of COVID-19 came, including Delta in the summer of 2021, and now the Omicron variant, which comprises the majority of cases in the U.S.
The United States as of Oct. 28 reached over 1 million COVID-19-related deaths and 97.4 million COVID-19 cases, according to Johns Hopkins University. Currently, 68.4% of the population is fully vaccinated, and 7.3% of people have received the most recent bivalent booster dose.
Stacker compiled a list of the counties with highest COVID-19 vaccination rates in Arizona using data from the U.S. Department of Health & Human Services and Covid Act Now. Counties are ranked by the highest vaccination rate as of Oct. 27, 2022. Due to inconsistencies in reporting, some counties do not have vaccination data available. Case count data based on Oct. 13 numbers reported by the Department of Health and Human Services. Keep reading to see whether your county ranks among the highest COVID-19 vaccination rates in your state.
![]()

Africaspotter // Wikimedia Commons
#14. Mohave County
– Population that is fully vaccinated: 43.0% (91,278 fully vaccinated)
— 24.8% lower vaccination rate than Arizona
– Cumulative deaths per 100k: 737 (1,564 total deaths)
— 70.2% more deaths per 100k residents than Arizona
– Cumulative cases per 100k: 30,189 (64,056 total cases)
— 4.0% less cases per 100k residents than Arizona
Bill Morrow // Wikimedia Commons
#13. Greenlee County
– Population that is fully vaccinated: 44.9% (4,268 fully vaccinated)
— 21.5% lower vaccination rate than Arizona
– Cumulative deaths per 100k: 411 (39 total deaths)
— 5.1% less deaths per 100k residents than Arizona
– Cumulative cases per 100k: 26,153 (2,484 total cases)
— 16.8% less cases per 100k residents than Arizona

Martha.baden // Wikimedia
#12. Yavapai County
– Population that is fully vaccinated: 49.9% (117,359 fully vaccinated)
— 12.8% lower vaccination rate than Arizona
– Cumulative deaths per 100k: 550 (1,292 total deaths)
— 27.0% more deaths per 100k residents than Arizona
– Cumulative cases per 100k: 23,707 (55,735 total cases)
— 24.6% less cases per 100k residents than Arizona
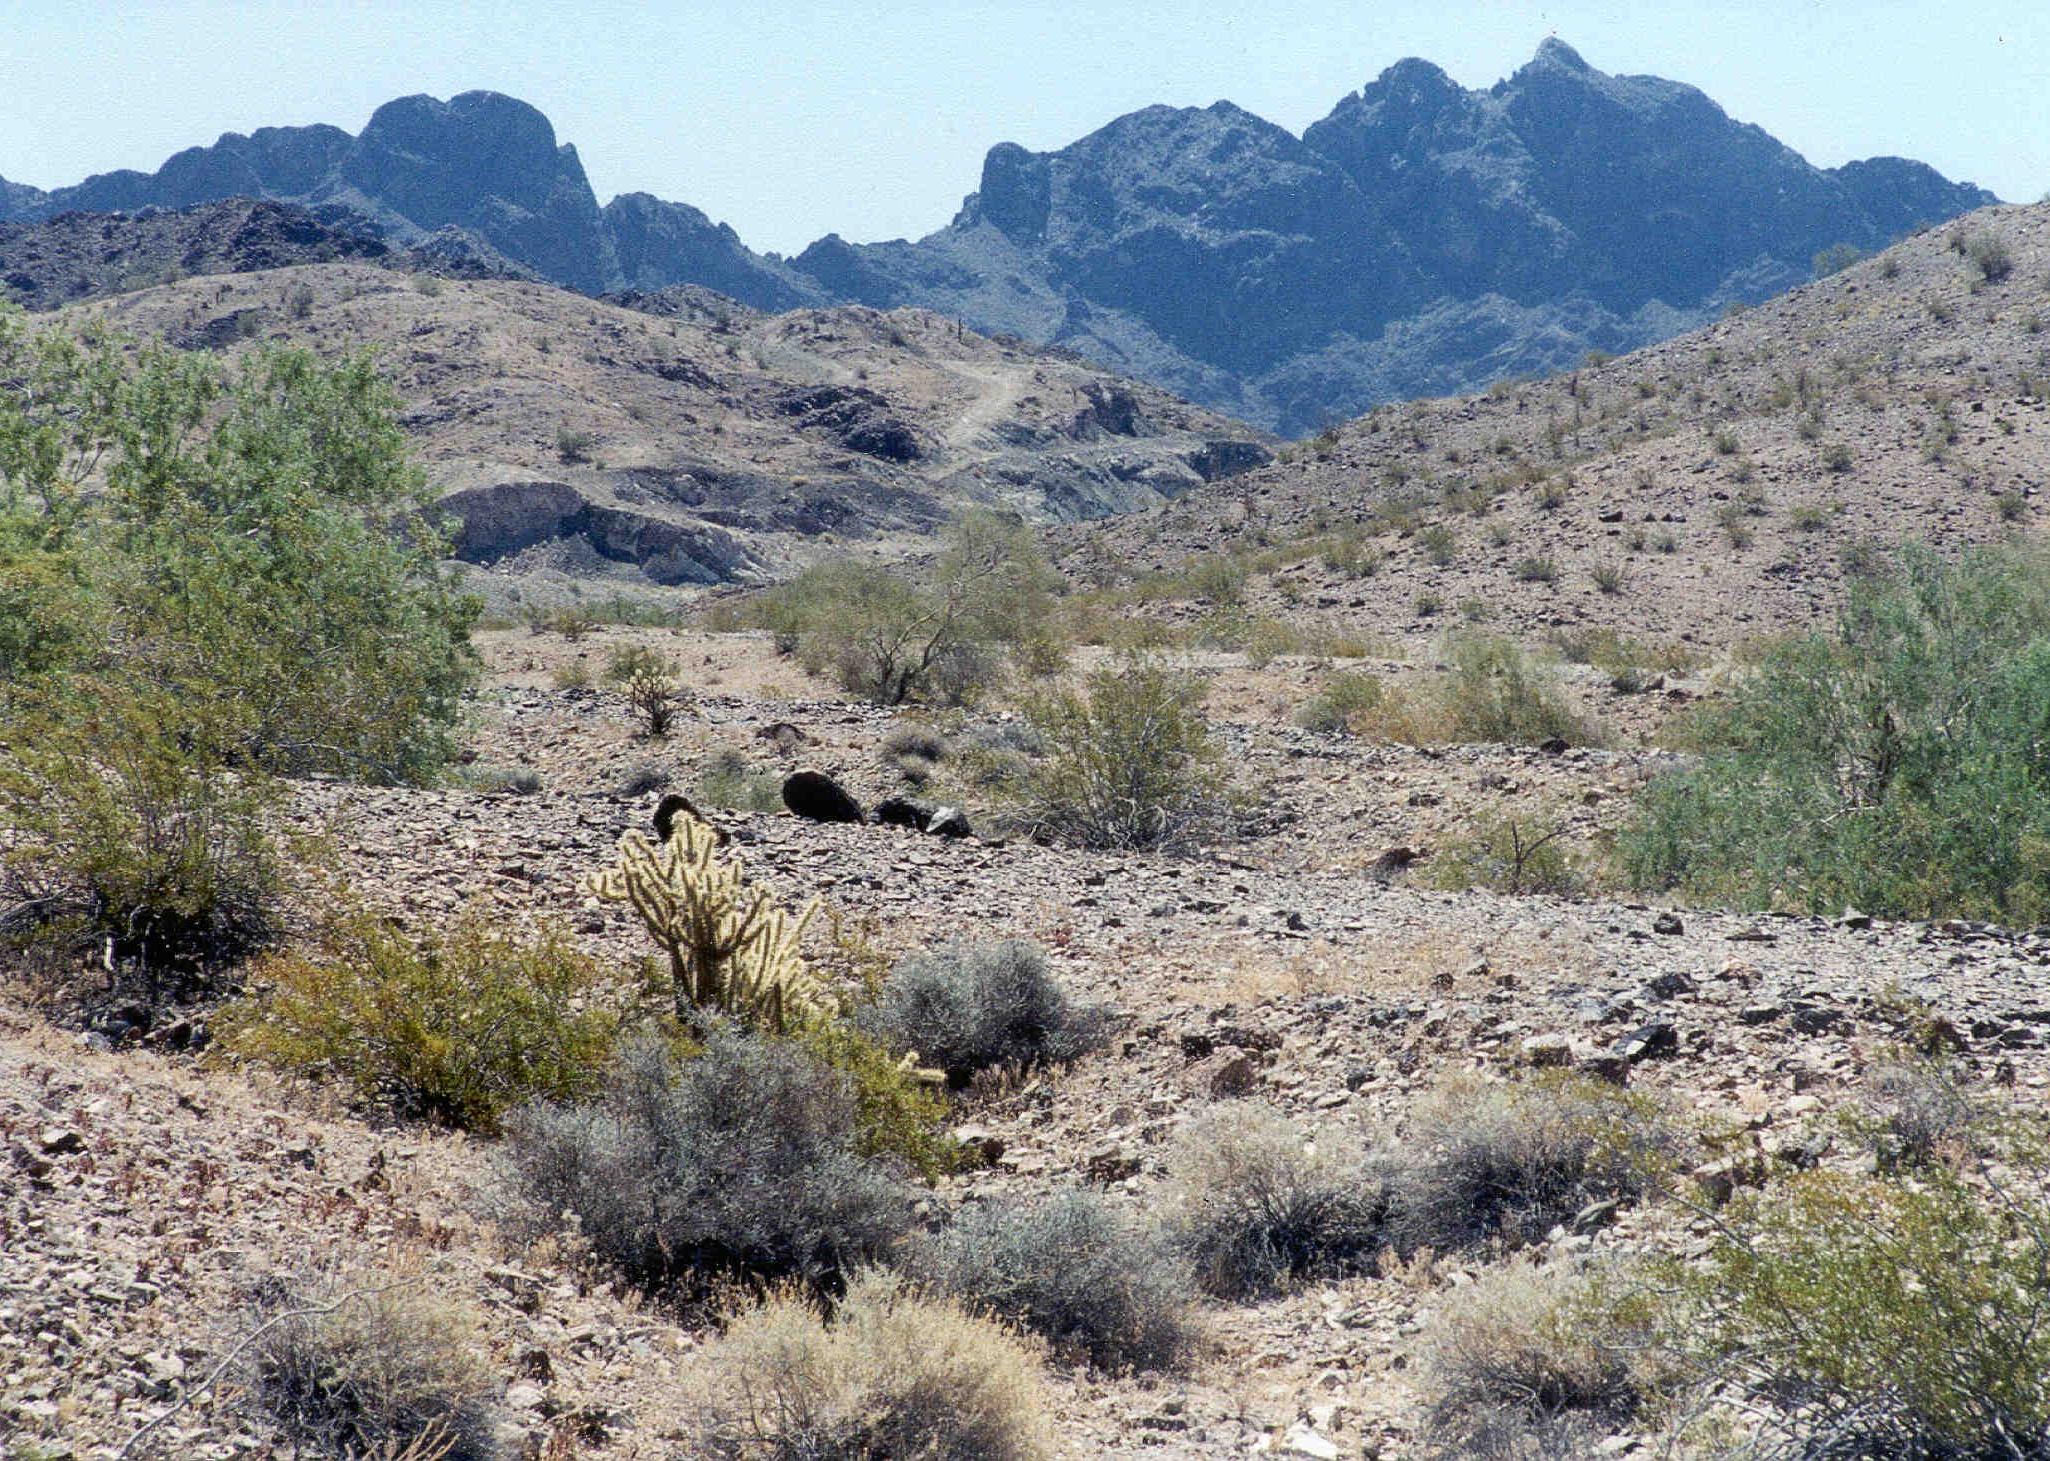
United States Bureau of Land Management // Wikimedia Commons
#11. La Paz County
– Population that is fully vaccinated: 50.0% (10,563 fully vaccinated)
— 12.6% lower vaccination rate than Arizona
– Cumulative deaths per 100k: 715 (151 total deaths)
— 65.1% more deaths per 100k residents than Arizona
– Cumulative cases per 100k: 27,359 (5,775 total cases)
— 13.0% less cases per 100k residents than Arizona

zeesstof // Wikimedia Commons
#10. Pinal County
– Population that is fully vaccinated: 55.9% (258,639 fully vaccinated)
— 2.3% lower vaccination rate than Arizona
– Cumulative deaths per 100k: 375 (1,737 total deaths)
— 13.4% less deaths per 100k residents than Arizona
– Cumulative cases per 100k: 32,077 (148,450 total cases)
— 2.0% more cases per 100k residents than Arizona

Sean Pavone // Shutterstock
#9. Maricopa County
– Population that is fully vaccinated: 59.4% (2,666,549 fully vaccinated)
— 3.8% higher vaccination rate than Arizona
– Cumulative deaths per 100k: 402 (18,028 total deaths)
— 7.2% less deaths per 100k residents than Arizona
– Cumulative cases per 100k: 31,961 (1,433,560 total cases)
— 1.7% more cases per 100k residents than Arizona
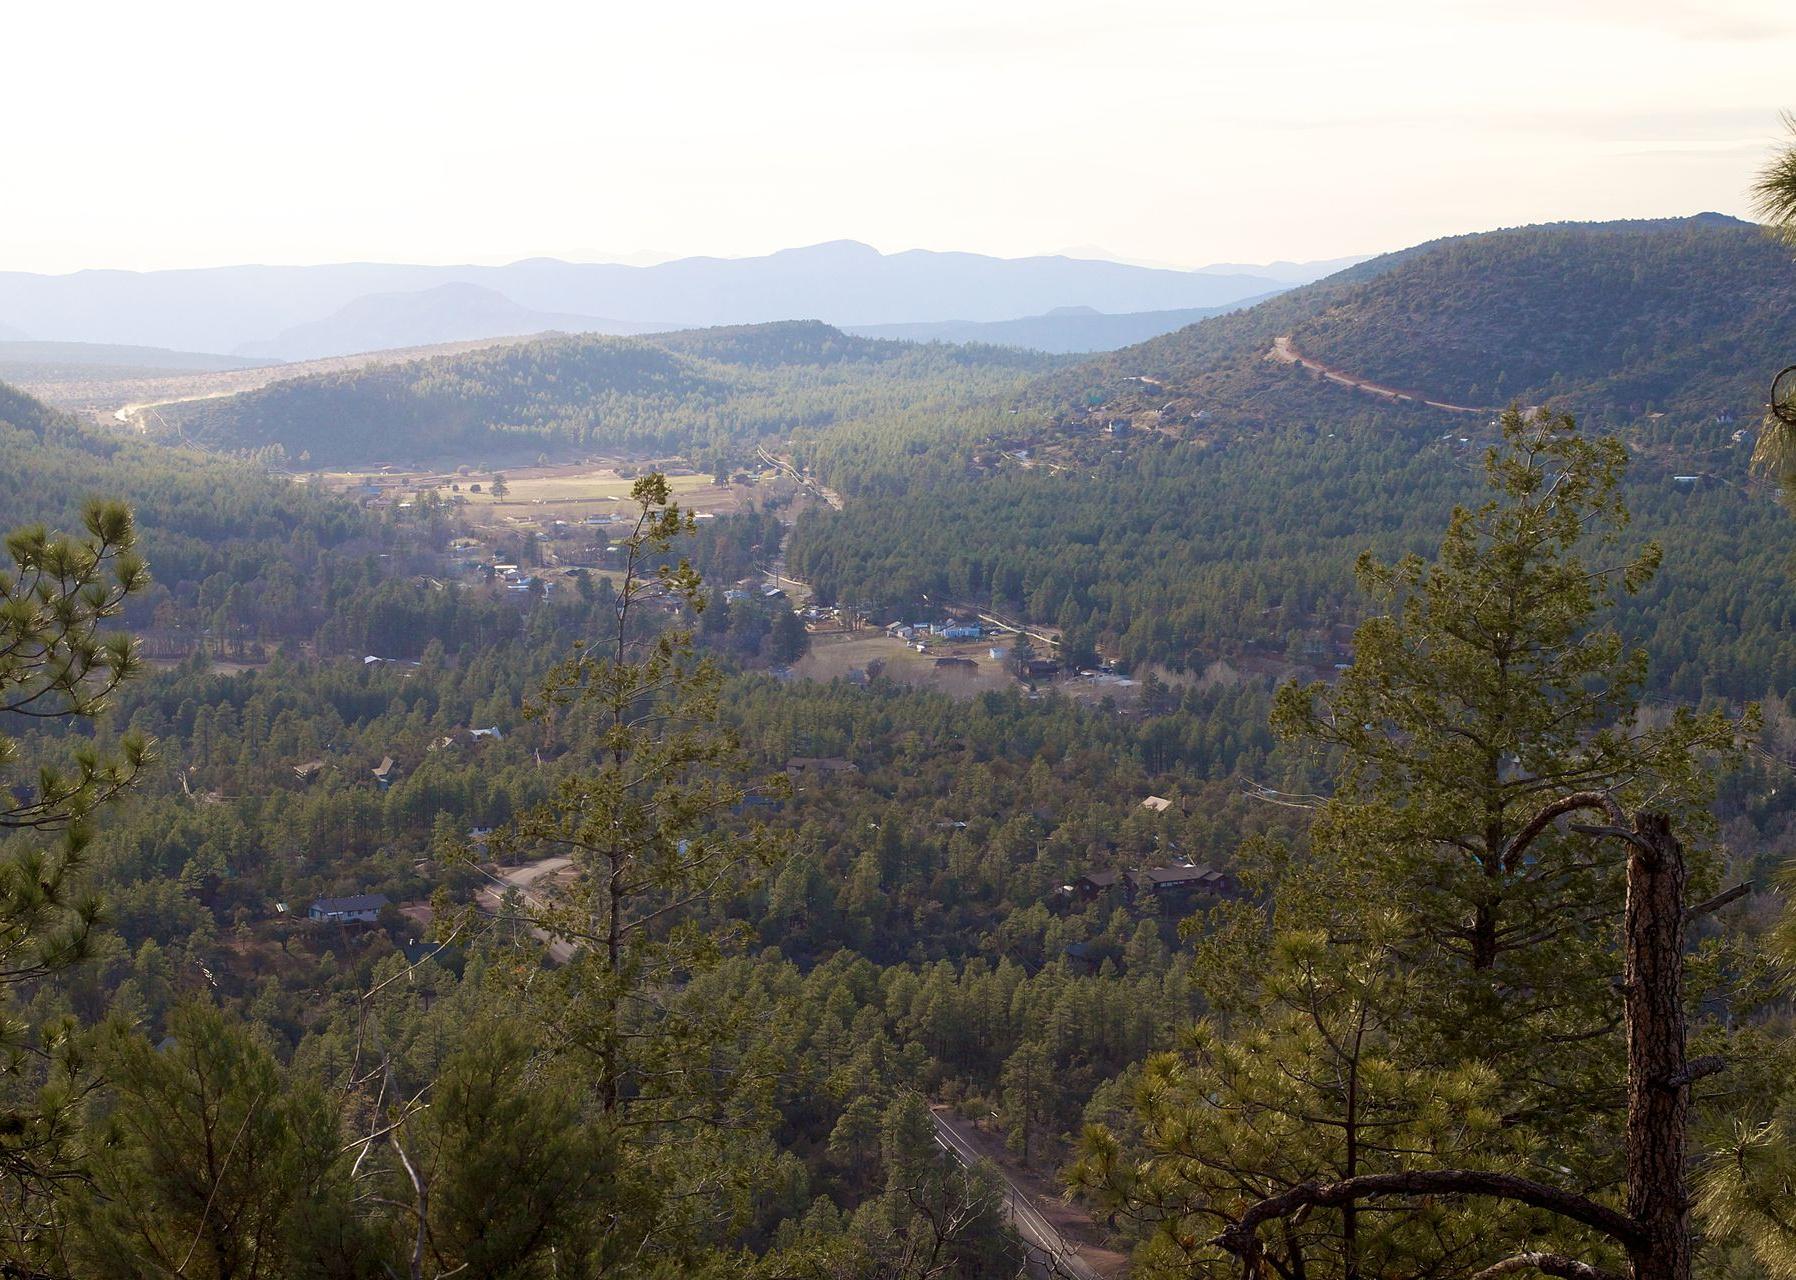
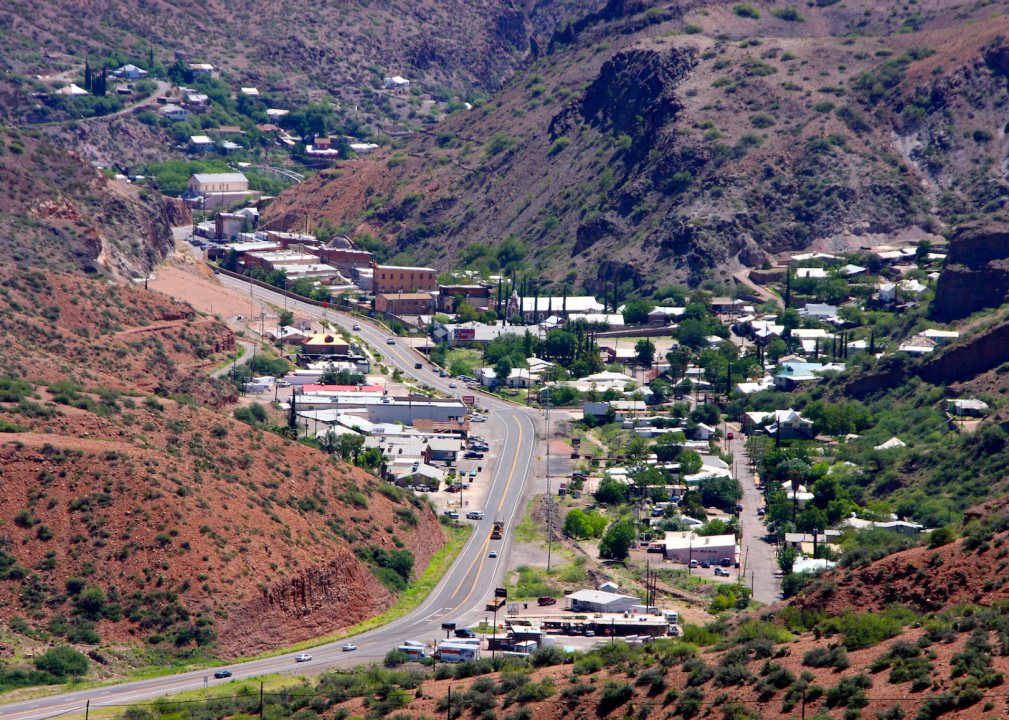
Alan Levine // Wikimedia Commons
#8. Gila County
– Population that is fully vaccinated: 61.1% (33,017 fully vaccinated)
— 6.8% higher vaccination rate than Arizona
– Cumulative deaths per 100k: 742 (401 total deaths)
— 71.4% more deaths per 100k residents than Arizona
– Cumulative cases per 100k: 37,001 (19,987 total cases)
— 17.7% more cases per 100k residents than Arizona

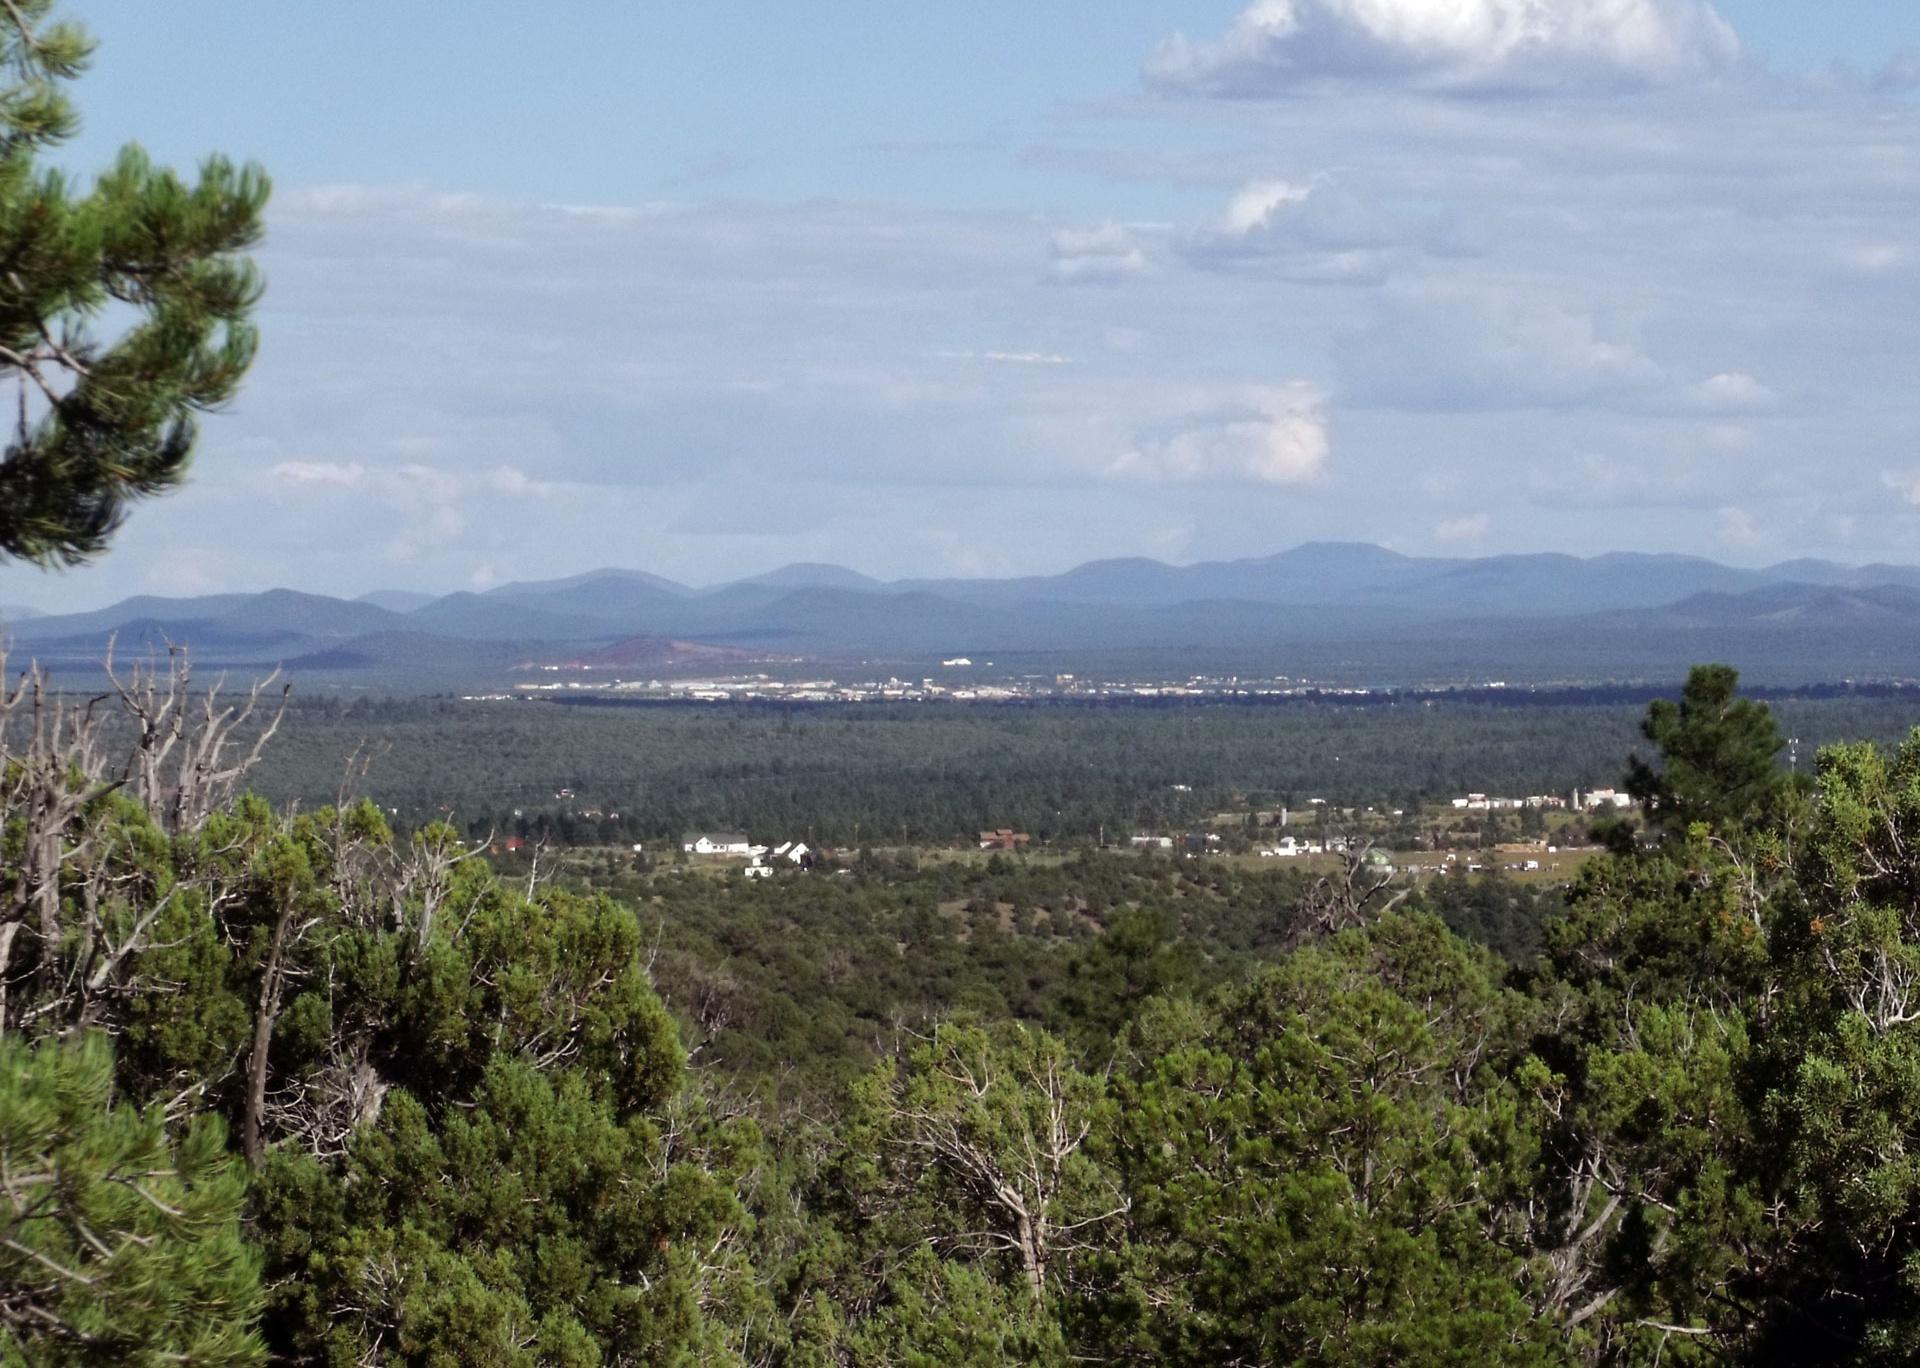
Wars // Wikimedia Commons
#7. Graham County
– Population that is fully vaccinated: 65.8% (25,566 fully vaccinated)
— 15.0% higher vaccination rate than Arizona
– Cumulative deaths per 100k: 474 (184 total deaths)
— 9.5% more deaths per 100k residents than Arizona
– Cumulative cases per 100k: 34,683 (13,470 total cases)
— 10.3% more cases per 100k residents than Arizona

Clay Gilliland // Flickr
#6. Cochise County
– Population that is fully vaccinated: 68.2% (85,874 fully vaccinated)
— 19.2% higher vaccination rate than Arizona
– Cumulative deaths per 100k: 474 (597 total deaths)
— 9.5% more deaths per 100k residents than Arizona
– Cumulative cases per 100k: 28,938 (36,439 total cases)
— 7.9% less cases per 100k residents than Arizona

Jay Yuan // Shutterstock
#5. Pima County
– Population that is fully vaccinated: 72.1% (755,573 fully vaccinated)
— 26.0% higher vaccination rate than Arizona
– Cumulative deaths per 100k: 385 (4,027 total deaths)
— 11.1% less deaths per 100k residents than Arizona
– Cumulative cases per 100k: 28,121 (294,502 total cases)
— 10.5% less cases per 100k residents than Arizona

Ken Lund // Flickr
#4. Yuma County
– Population that is fully vaccinated: 73.4% (156,851 fully vaccinated)
— 28.3% higher vaccination rate than Arizona
– Cumulative deaths per 100k: 569 (1,216 total deaths)
— 31.4% more deaths per 100k residents than Arizona
– Cumulative cases per 100k: 31,798 (67,979 total cases)
— 1.2% more cases per 100k residents than Arizona

HildaWeges Photography // Shutterstock
#3. Coconino County
– Population that is fully vaccinated: 80.4% (115,321 fully vaccinated)
— 40.6% higher vaccination rate than Arizona
– Cumulative deaths per 100k: 350 (502 total deaths)
— 19.2% less deaths per 100k residents than Arizona
– Cumulative cases per 100k: 35,027 (50,256 total cases)
— 11.4% more cases per 100k residents than Arizona
Ixnayonthetimmay // Wikimedia Commons
#2. Navajo County
– Population that is fully vaccinated: 81.2% (90,116 fully vaccinated)
— 42.0% higher vaccination rate than Arizona
– Cumulative deaths per 100k: 852 (945 total deaths)
— 96.8% more deaths per 100k residents than Arizona
– Cumulative cases per 100k: 40,210 (44,602 total cases)
— 27.9% more cases per 100k residents than Arizona

Andreas F. Borchert // Wikimedia Commons
#1. Apache County
– Population that is fully vaccinated: 95.0% (77,551 fully vaccinated)
— 66.1% higher vaccination rate than Arizona
– Cumulative deaths per 100k: 871 (626 total deaths)
— 101.2% more deaths per 100k residents than Arizona
– Cumulative cases per 100k: 44,500 (31,990 total cases)
— 41.6% more cases per 100k residents than Arizona