Most diverse counties in Arizona
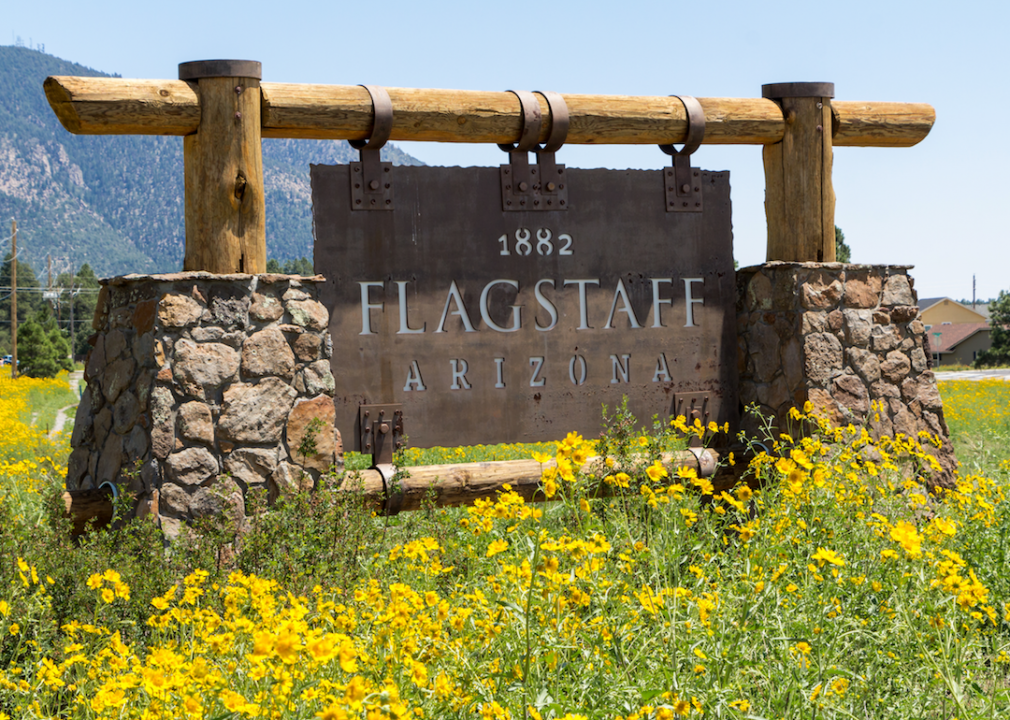
HildaWeges Photography // Shutterstock
Most diverse counties in Arizona
The United States has a longstanding reputation as being a melting pot (or salad bowl), with its diversity manifesting itself across many different demographics. However, some places across the country are notably more heterogeneous than others.
Stacker compiled a list of the most diverse counties in Arizona using data from using data from the U.S. Census Bureau. Counties are ranked by the highest Simpson’s diversity index score. Simpson’s diversity index measures community diversity on a scale of 0 (least diverse) to 1 (most diverse), more on the calculation can be read here.
Think you know which counties in your home state might be the most diverse? Keep reading to see if your predictions are correct.
You may also like: Counties with the most college graduates in Arizona
![]()

Bill Morrow // Wikimedia Commons
#15. Greenlee County
– Index: 0.160
– Total population: 9,522
– White: 91.5% (8,715)
– Black or African American: 2.2% (209)
– American Indian and Alaska Native: 3.9% (369)
– Asian: 0.5% (52)
– Native Hawaiian and other Pacific Islander: 0.0% (0)
– 2 or more races: 0.5% (51)
– Some other Race: 1.3% (126)
Martha.baden // Wikimedia
#14. Yavapai County
– Index: 0.164
– Total population: 228,067
– White: 91.3% (208,248)
– Black or African American: 0.7% (1,495)
– American Indian and Alaska Native: 1.7% (3,819)
– Asian: 1.0% (2,205)
– Native Hawaiian and other Pacific Islander: 0.1% (165)
– 2 or more races: 2.6% (6,033)
– Some other Race: 2.7% (6,102)
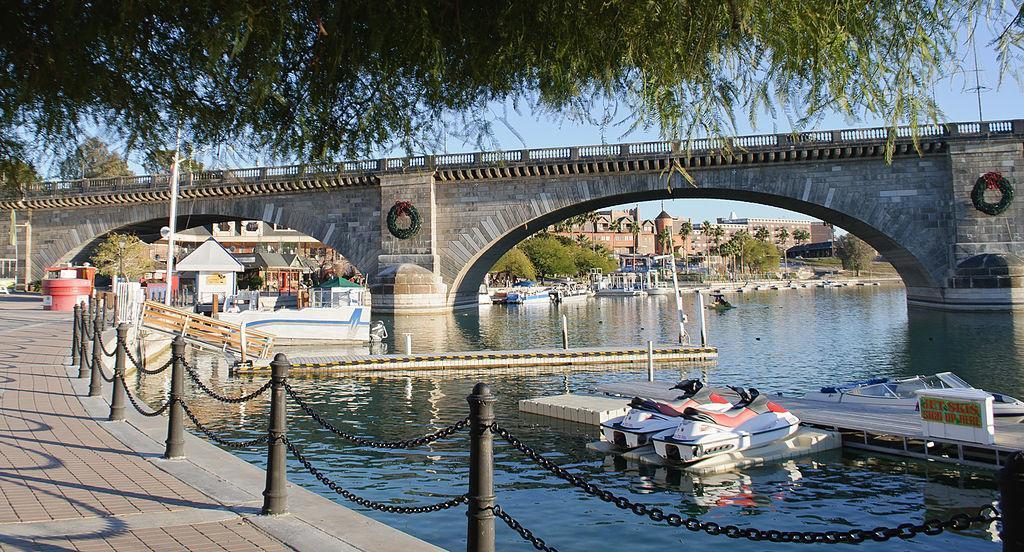
InSapphoWeTrust // Wikicommons
#13. Mohave County
– Index: 0.184
– Total population: 207,695
– White: 90.2% (187,413)
– Black or African American: 1.1% (2,217)
– American Indian and Alaska Native: 2.3% (4,727)
– Asian: 1.1% (2,314)
– Native Hawaiian and other Pacific Islander: 0.2% (458)
– 2 or more races: 2.5% (5,241)
– Some other Race: 2.6% (5,325)

Elnogalense // Wikimedia Commons
#12. Santa Cruz County
– Index: 0.254
– Total population: 46,480
– White: 85.7% (39,840)
– Black or African American: 0.6% (301)
– American Indian and Alaska Native: 0.8% (360)
– Asian: 0.9% (424)
– Native Hawaiian and other Pacific Islander: 0.0% (0)
– 2 or more races: 1.3% (624)
– Some other Race: 10.6% (4,931)
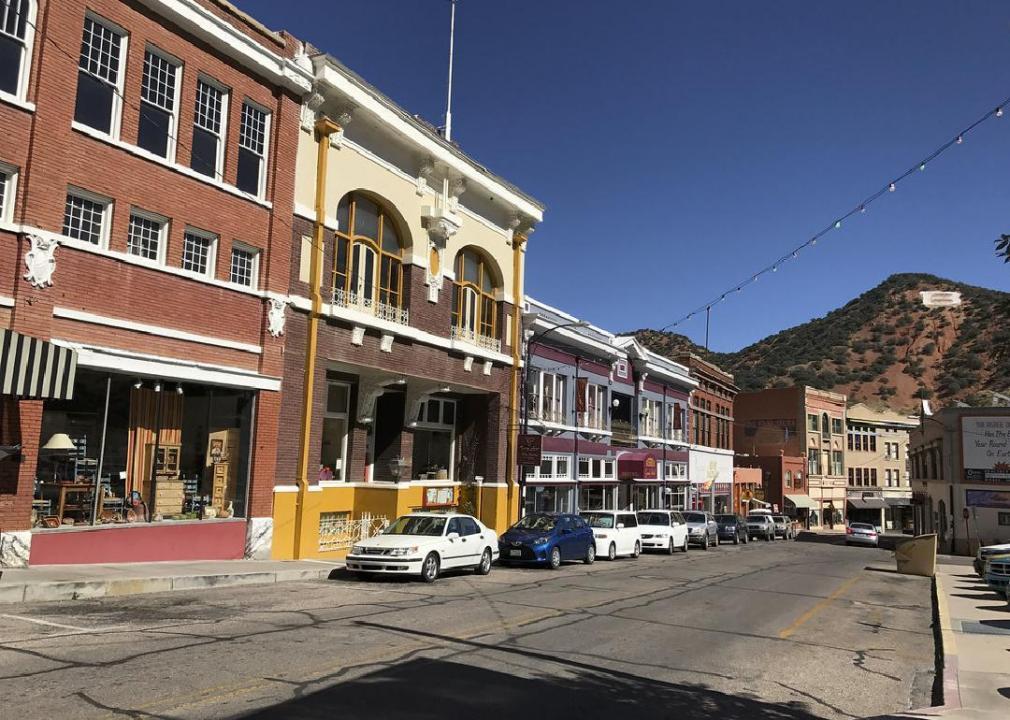
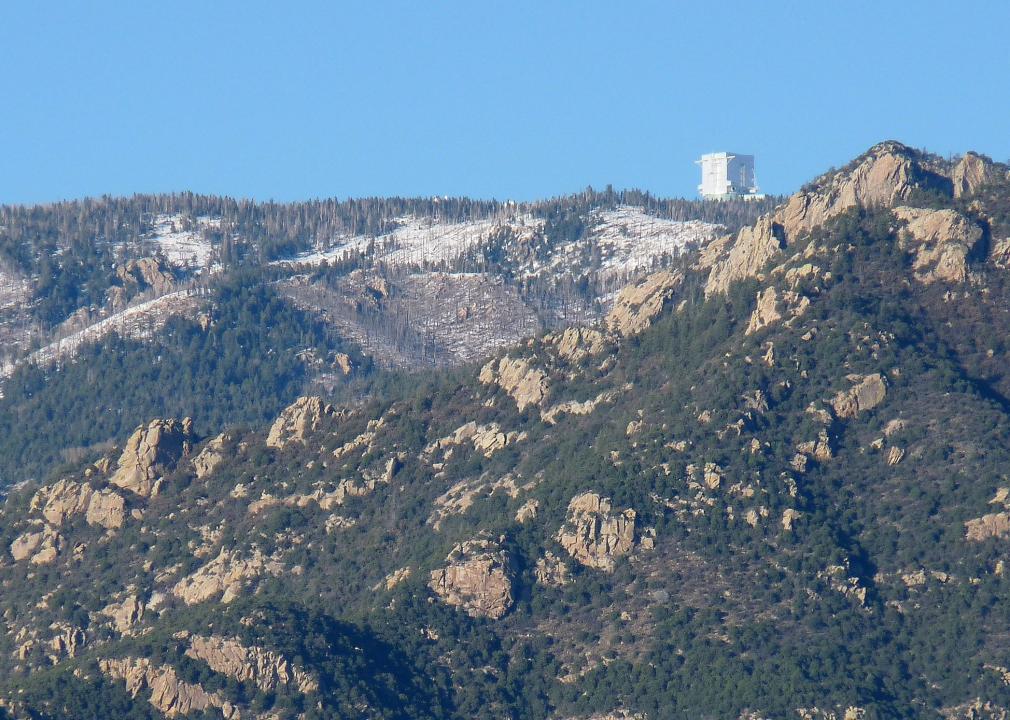
Clay Gilliland // Flickr
#11. Cochise County
– Index: 0.265
– Total population: 125,867
– White: 85.5% (107,581)
– Black or African American: 4.1% (5,132)
– American Indian and Alaska Native: 1.2% (1,563)
– Asian: 1.9% (2,445)
– Native Hawaiian and other Pacific Islander: 0.4% (482)
– 2 or more races: 4.1% (5,202)
– Some other Race: 2.8% (3,462)
You may also like: Counties with the worst commutes in Arizona
Wars // Wikimedia Commons
#10. Graham County
– Index: 0.344
– Total population: 37,996
– White: 79.9% (30,366)
– Black or African American: 2.0% (744)
– American Indian and Alaska Native: 12.6% (4,804)
– Asian: 0.6% (240)
– Native Hawaiian and other Pacific Islander: 0.1% (46)
– 2 or more races: 2.9% (1,095)
– Some other Race: 1.8% (701)
zeesstof // Wikimedia Commons
#9. Pinal County
– Index: 0.353
– Total population: 432,793
– White: 79.9% (345,754)
– Black or African American: 4.4% (18,915)
– American Indian and Alaska Native: 5.0% (21,852)
– Asian: 1.6% (7,139)
– Native Hawaiian and other Pacific Islander: 0.3% (1,365)
– 2 or more races: 4.2% (18,120)
– Some other Race: 4.5% (19,648)
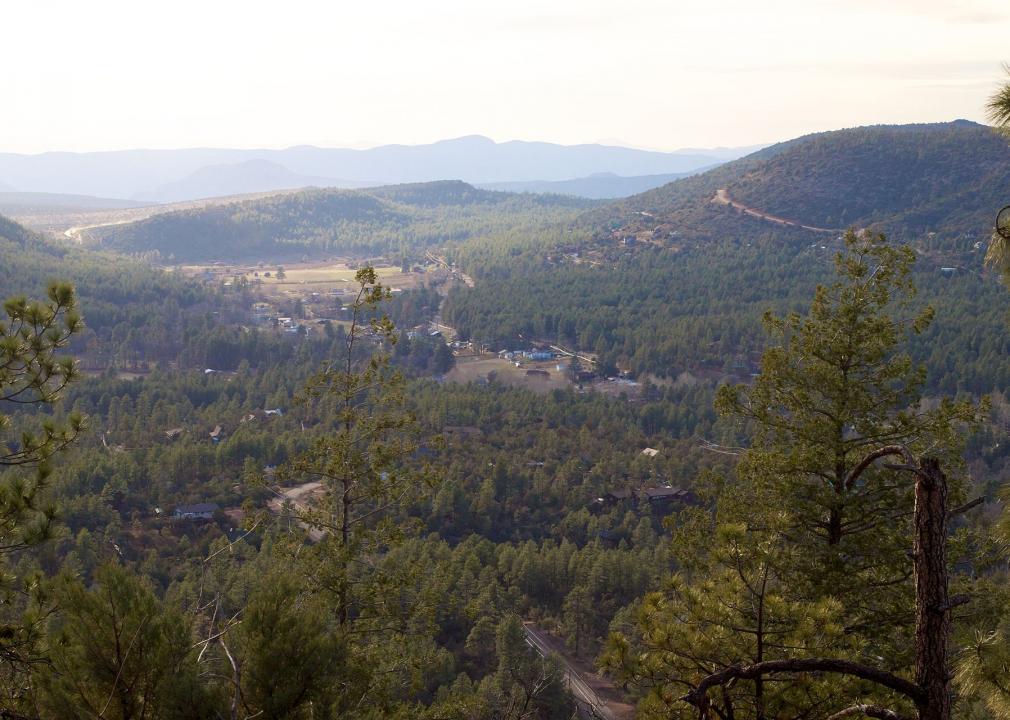
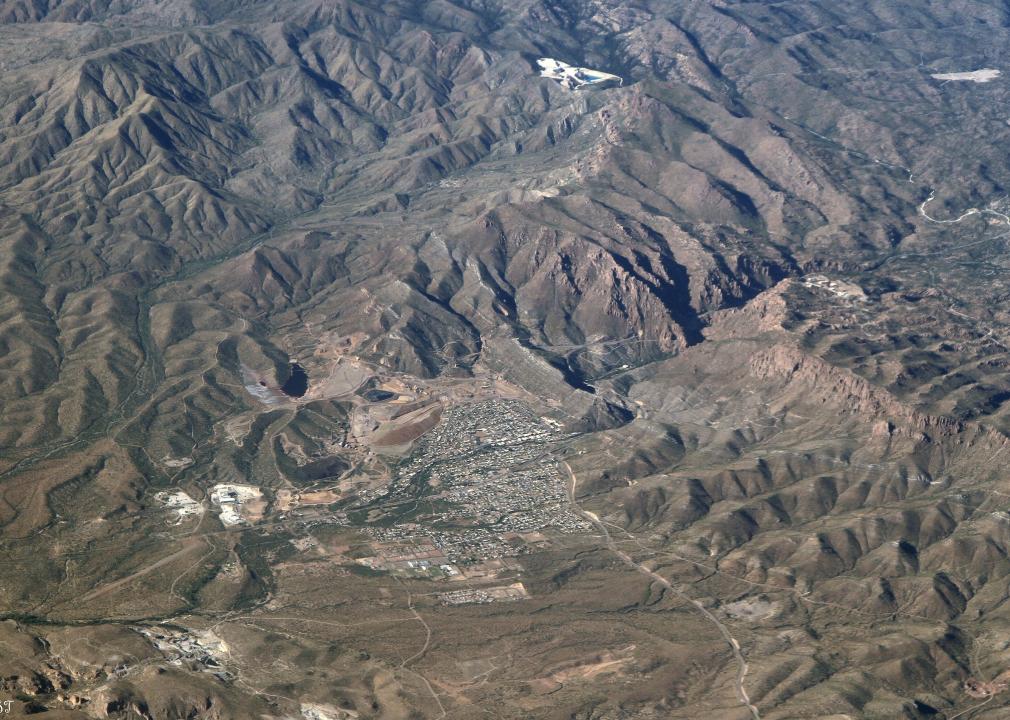
Alan Levine // Wikimedia Commons
#8. Gila County
– Index: 0.381
– Total population: 53,546
– White: 76.9% (41,171)
– Black or African American: 0.7% (375)
– American Indian and Alaska Native: 16.3% (8,733)
– Asian: 0.8% (439)
– Native Hawaiian and other Pacific Islander: 0.0% (22)
– 2 or more races: 3.0% (1,622)
– Some other Race: 2.2% (1,184)
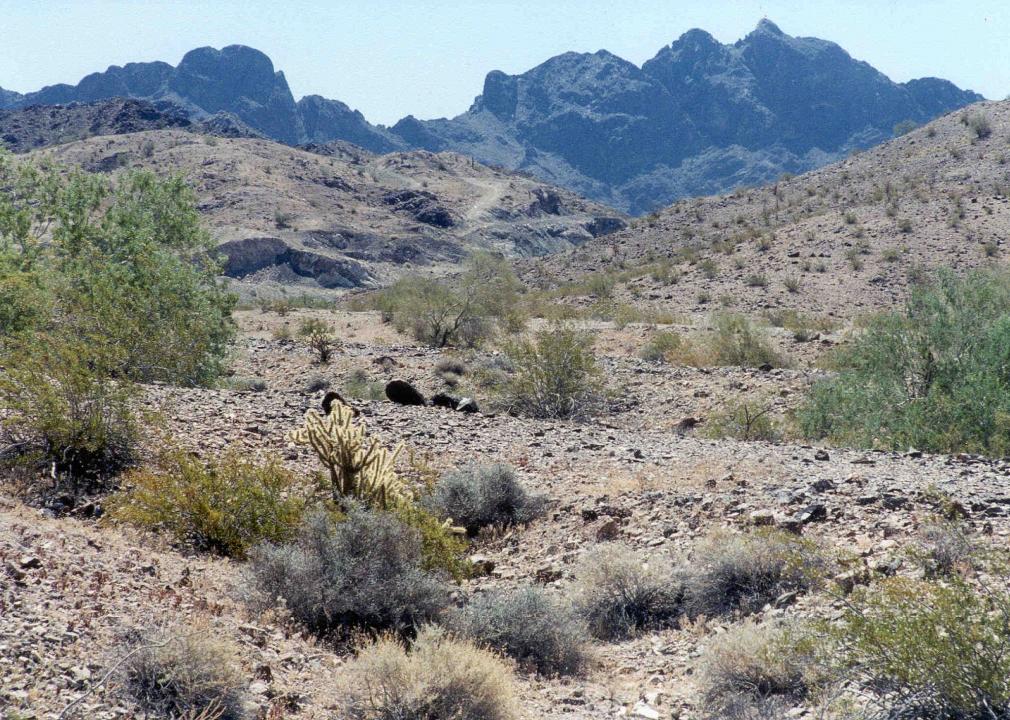
United States Bureau of Land Management // Wikimedia Commons
#7. La Paz County
– Index: 0.381
– Total population: 20,793
– White: 77.1% (16,035)
– Black or African American: 1.0% (200)
– American Indian and Alaska Native: 15.0% (3,109)
– Asian: 0.7% (151)
– Native Hawaiian and other Pacific Islander: 0.0% (10)
– 2 or more races: 2.8% (582)
– Some other Race: 3.4% (706)

Sean Pavone // Shutterstock
#6. Maricopa County
– Index: 0.386
– Total population: 4.3 million
– White: 77.6% (3,360,305)
– Black or African American: 5.6% (243,640)
– American Indian and Alaska Native: 2.0% (85,876)
– Asian: 4.2% (181,352)
– Native Hawaiian and other Pacific Islander: 0.2% (9,694)
– 2 or more races: 3.7% (159,113)
– Some other Race: 6.7% (288,830)
You may also like: Biggest sources of immigrants to Arizona

Ken L. // Flickr
#5. Yuma County
– Index: 0.391
– Total population: 209,468
– White: 76.3% (159,864)
– Black or African American: 2.2% (4,533)
– American Indian and Alaska Native: 1.5% (3,234)
– Asian: 1.3% (2,777)
– Native Hawaiian and other Pacific Islander: 0.1% (167)
– 2 or more races: 2.7% (5,703)
– Some other Race: 15.8% (33,190)
Andreas F. Borchert // Wikimedia Commons
#4. Apache County
– Index: 0.403
– Total population: 71,511
– White: 22.8% (16,328)
– Black or African American: 0.5% (373)
– American Indian and Alaska Native: 73.8% (52,755)
– Asian: 0.3% (246)
– Native Hawaiian and other Pacific Islander: 0.0% (20)
– 2 or more races: 1.7% (1,240)
– Some other Race: 0.8% (549)

Jay Yuan // Shutterstock
#3. Pima County
– Index: 0.409
– Total population: 1.0 million
– White: 76.0% (781,004)
– Black or African American: 3.6% (36,581)
– American Indian and Alaska Native: 3.9% (39,914)
– Asian: 2.9% (30,011)
– Native Hawaiian and other Pacific Islander: 0.2% (1,653)
– 2 or more races: 4.9% (50,153)
– Some other Race: 8.6% (87,891)

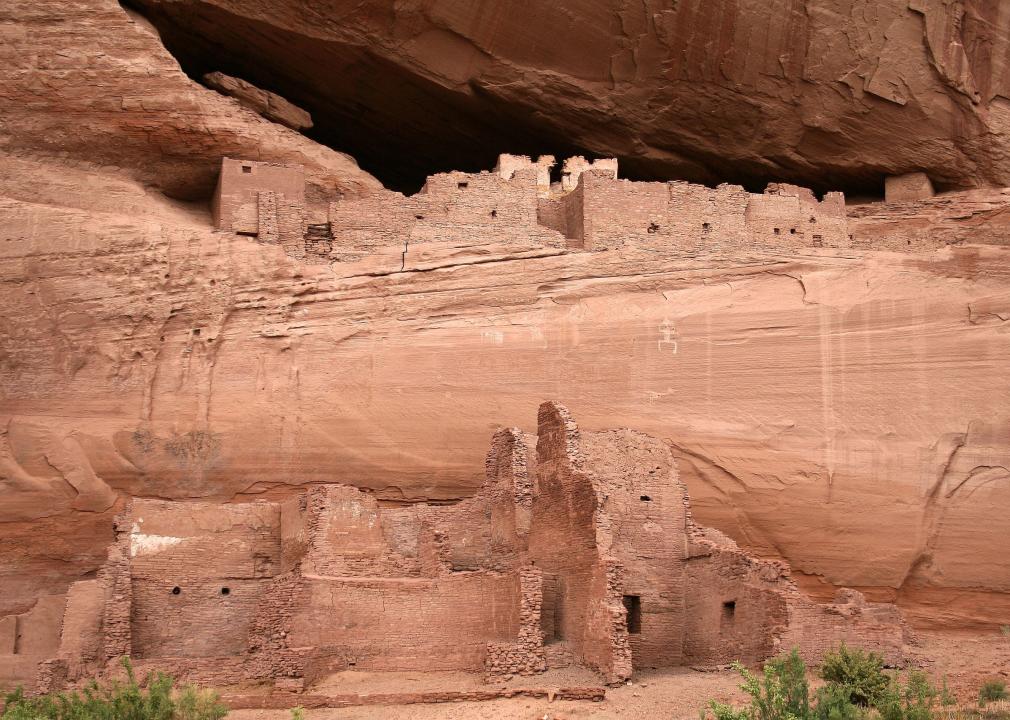
HildaWeges Photography // Shutterstock
#2. Coconino County
– Index: 0.518
– Total population: 141,274
– White: 63.9% (90,333)
– Black or African American: 1.2% (1,742)
– American Indian and Alaska Native: 26.5% (37,504)
– Asian: 2.0% (2,766)
– Native Hawaiian and other Pacific Islander: 0.2% (235)
– 2 or more races: 3.6% (5,110)
– Some other Race: 2.5% (3,584)
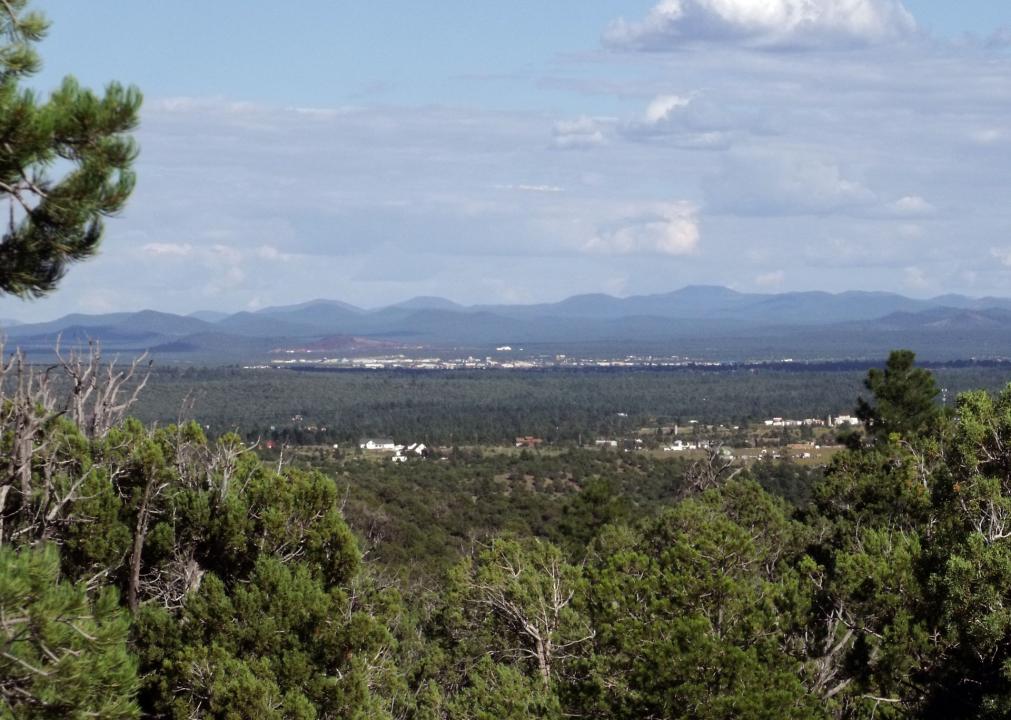
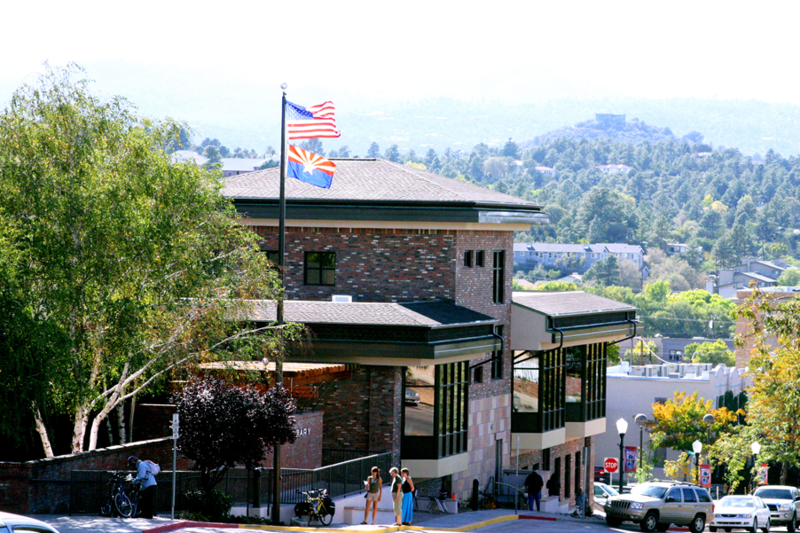
Ixnayonthetimmay // Wikimedia Commons
#1. Navajo County
– Index: 0.576
– Total population: 109,270
– White: 47.1% (51,496)
– Black or African American: 0.9% (1,005)
– American Indian and Alaska Native: 44.7% (48,795)
– Asian: 0.6% (652)
– Native Hawaiian and other Pacific Islander: 0.1% (141)
– 2 or more races: 2.9% (3,148)
– Some other Race: 3.7% (4,033)
You may also like: Fastest-growing counties in Arizona