Where people in San Diego are moving to most

SD Dirk // Flickr
Where people in San Diego are moving to most
Stacker compiled a list of where people in San Diego-Chula Vista-Carlsbad, CA Metro Area are moving to the most using data from the U.S. Census Bureau. Metros are ranked by the estimated number of people who moved to the metro from San Diego between 2015 and 2019. Ties were broken by gross migration.
You may also like: Highest-rated steakhouses in San Diego, according to Tripadvisor
![]()

spablab // Flickr
#50. Providence-Warwick, RI-MA Metro Area
– Migration to Providence in 2015-2019: 595
– Migration from Providence to San Diego: 670 (#13 most common destination from Providence)
– Net migration: 75 to San Diego

BusinessEditorUSA // Wikimedia Commons
#49. Charlotte-Concord-Gastonia, NC-SC Metro Area
– Migration to Charlotte in 2015-2019: 600
– Migration from Charlotte to San Diego: 127 (#102 most common destination from Charlotte)
– Net migration: 473 to Charlotte

Kolossos // Wikimedia Commons
#48. Miami-Fort Lauderdale-Pompano Beach, FL Metro Area
– Migration to Miami in 2015-2019: 612
– Migration from Miami to San Diego: 540 (#58 most common destination from Miami)
– Net migration: 72 to Miami

Songquan Deng // Shutterstock
#47. Orlando-Kissimmee-Sanford, FL Metro Area
– Migration to Orlando in 2015-2019: 613
– Migration from Orlando to San Diego: 295 (#59 most common destination from Orlando)
– Net migration: 318 to Orlando

Tony Webster // Wikicommons
#46. Minneapolis-St. Paul-Bloomington, MN-WI Metro Area
– Migration to Minneapolis in 2015-2019: 618
– Migration from Minneapolis to San Diego: 705 (#31 most common destination from Minneapolis)
– Net migration: 87 to San Diego
You may also like: Highest paying jobs that require a 2 year degree in San Diego
Aaronbrick // Wikicommons
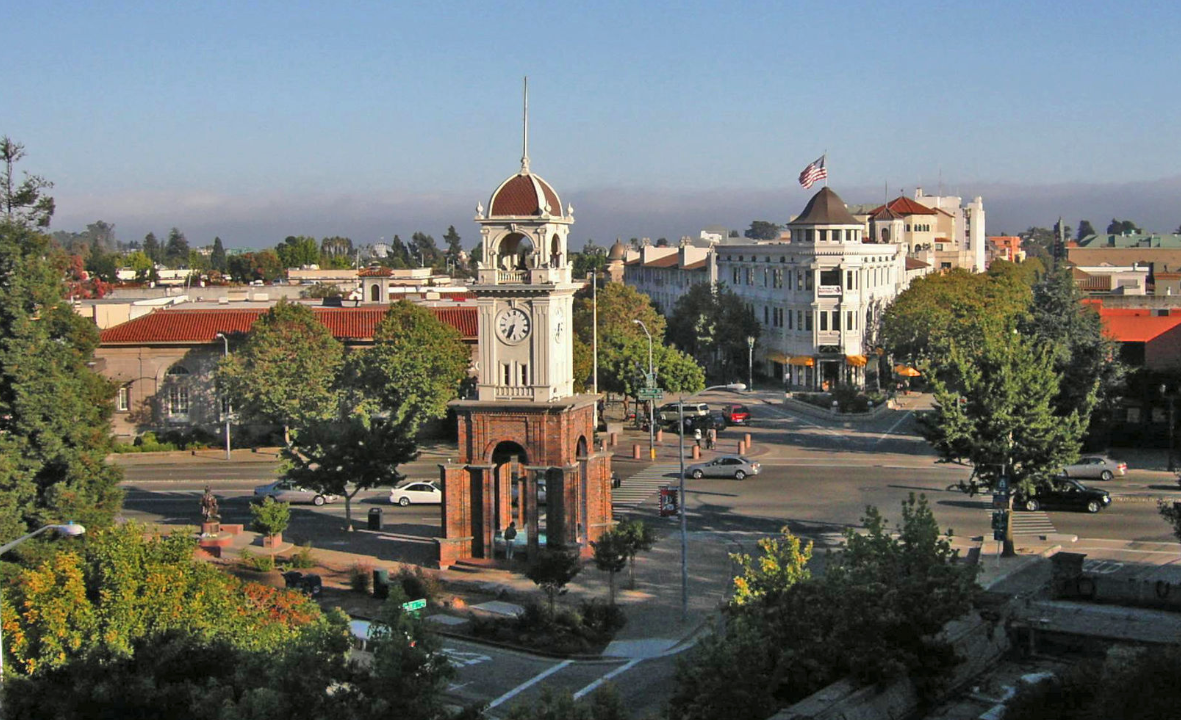
#45. Santa Cruz-Watsonville, CA Metro Area
– Migration to Santa Cruz in 2015-2019: 628
– Migration from Santa Cruz to San Diego: 375 (#8 most common destination from Santa Cruz)
– Net migration: 253 to Santa Cruz

Ken L. // Flickr
#44. Yuma, AZ Metro Area
– Migration to Yuma in 2015-2019: 644
– Migration from Yuma to San Diego: 470 (#3 most common destination from Yuma)
– Net migration: 174 to Yuma

Alvesgaspar // Wikimedia
#43. Tampa-St. Petersburg-Clearwater, FL Metro Area
– Migration to Tampa in 2015-2019: 650
– Migration from Tampa to San Diego: 708 (#31 most common destination from Tampa)
– Net migration: 58 to San Diego

Pedro Szekely // flickr
#42. New Orleans-Metairie, LA Metro Area
– Migration to New Orleans in 2015-2019: 650
– Migration from New Orleans to San Diego: 259 (#38 most common destination from New Orleans)
– Net migration: 391 to New Orleans

M.Bucka // Wikimedia Commons
#41. Albuquerque, NM Metro Area
– Migration to Albuquerque in 2015-2019: 654
– Migration from Albuquerque to San Diego: 316 (#20 most common destination from Albuquerque)
– Net migration: 338 to Albuquerque
You may also like: Highest-rated dessert shops in San Diego, according to Tripadvisor

MoodyGroove // Wikimedia Commons
#40. Hilton Head Island-Bluffton, SC Metro Area
– Migration to Hilton Head Island in 2015-2019: 667
– Migration from Hilton Head Island to San Diego: 1,769 (#1 most common destination from Hilton Head Island)
– Net migration: 1,102 to San Diego

Epccedu // Wikimedia Commons
#39. El Paso, TX Metro Area
– Migration to El Paso in 2015-2019: 728
– Migration from El Paso to San Diego: 186 (#48 most common destination from El Paso)
– Net migration: 542 to El Paso

Ben P L // Wikimedia Commons
#38. Provo-Orem, UT Metro Area
– Migration to Provo in 2015-2019: 746
– Migration from Provo to San Diego: 256 (#25 most common destination from Provo)
– Net migration: 490 to Provo

Naotake Murayama // Wikicommons
#37. Salinas, CA Metro Area
– Migration to Salinas in 2015-2019: 772
– Migration from Salinas to San Diego: 670 (#8 most common destination from Salinas)
– Net migration: 102 to Salinas

nickchapman // Wikicommons
#36. Bakersfield, CA Metro Area
– Migration to Bakersfield in 2015-2019: 821
– Migration from Bakersfield to San Diego: 949 (#7 most common destination from Bakersfield)
– Net migration: 128 to San Diego
You may also like: Lowest-paying jobs in San Diego

Derek.cashman // Wikicommons
#35. Flagstaff, AZ Metro Area
– Migration to Flagstaff in 2015-2019: 859
– Migration from Flagstaff to San Diego: 376 (#5 most common destination from Flagstaff)
– Net migration: 483 to Flagstaff

Robert Corby // Wikimedia Commons
#34. Colorado Springs, CO Metro Area
– Migration to Colorado Springs in 2015-2019: 876
– Migration from Colorado Springs to San Diego: 956 (#10 most common destination from Colorado Springs)
– Net migration: 80 to San Diego

Armona // Wikicommons
#33. Hanford-Corcoran, CA Metro Area
– Migration to Hanford in 2015-2019: 903
– Migration from Hanford to San Diego: 331 (#8 most common destination from Hanford)
– Net migration: 572 to Hanford

Basar // Wikicommons
#32. San Luis Obispo-Paso Robles, CA Metro Area
– Migration to San Luis Obispo in 2015-2019: 917
– Migration from San Luis Obispo to San Diego: 748 (#4 most common destination from San Luis Obispo)
– Net migration: 169 to San Luis Obispo

Famartin // Wikicommons
#31. Baltimore-Columbia-Towson, MD Metro Area
– Migration to Baltimore in 2015-2019: 1,009
– Migration from Baltimore to San Diego: 778 (#29 most common destination from Baltimore)
– Net migration: 231 to Baltimore
You may also like: Cities with the fastest growing home prices in San Diego metro area

AndrewAvitus // Wikicommons’
#30. Jacksonville, FL Metro Area
– Migration to Jacksonville in 2015-2019: 1,062
– Migration from Jacksonville to San Diego: 927 (#12 most common destination from Jacksonville)
– Net migration: 135 to Jacksonville

Pixabay
#29. Austin-Round Rock-Georgetown, TX Metro Area
– Migration to Austin in 2015-2019: 1,128
– Migration from Austin to San Diego: 346 (#45 most common destination from Austin)
– Net migration: 782 to Austin

Boise Metro Chamber // Flickr
#28. Boise City, ID Metro Area
– Migration to Boise City in 2015-2019: 1,176
– Migration from Boise City to San Diego: 318 (#15 most common destination from Boise City)
– Net migration: 858 to Boise City

Jdcollins13 // Wikimedia Commons
#27. Jacksonville, NC Metro Area
– Migration to Jacksonville in 2015-2019: 1,182
– Migration from Jacksonville to San Diego: 1,192 (#1 most common destination from Jacksonville)
– Net migration: 10 to San Diego

Cbl62 // Wikicommons
#26. El Centro, CA Metro Area
– Migration to El Centro in 2015-2019: 1,210
– Migration from El Centro to San Diego: 1,204 (#1 most common destination from El Centro)
– Net migration: 6 to El Centro
You may also like: Cities with the most expensive homes in San Diego metro area

LPS.1 // Wikicommons
#25. Stockton, CA Metro Area
– Migration to Stockton in 2015-2019: 1,243
– Migration from Stockton to San Diego: 467 (#10 most common destination from Stockton)
– Net migration: 776 to Stockton

CameronK23 // Wikimedia Commons
#24. Oxnard-Thousand Oaks-Ventura, CA Metro Area
– Migration to Oxnard in 2015-2019: 1,356
– Migration from Oxnard to San Diego: 1,108 (#5 most common destination from Oxnard)
– Net migration: 248 to Oxnard

Sue Stokes // Shutterstock
#23. Bremerton-Silverdale-Port Orchard, WA Metro Area
– Migration to Bremerton in 2015-2019: 1,375
– Migration from Bremerton to San Diego: 571 (#2 most common destination from Bremerton)
– Net migration: 804 to Bremerton

Pixabay
#22. San Antonio-New Braunfels, TX Metro Area
– Migration to San Antonio in 2015-2019: 1,391
– Migration from San Antonio to San Diego: 753 (#20 most common destination from San Antonio)
– Net migration: 638 to San Antonio

Keizers // Wikimedia Commons
#21. Atlanta-Sandy Springs-Alpharetta, GA Metro Area
– Migration to Atlanta in 2015-2019: 1,393
– Migration from Atlanta to San Diego: 779 (#55 most common destination from Atlanta)
– Net migration: 614 to Atlanta
You may also like: Highest-rated pizza restaurants in San Diego, according to Tripadvisor

Sean Pavone // Shutterstock
#20. Boston-Cambridge-Newton, MA-NH Metro Area
– Migration to Boston in 2015-2019: 1,427
– Migration from Boston to San Diego: 1,619 (#19 most common destination from Boston)
– Net migration: 192 to San Diego

Pixabay
#19. Santa Maria-Santa Barbara, CA Metro Area
– Migration to Santa Maria in 2015-2019: 1,513
– Migration from Santa Maria to San Diego: 837 (#7 most common destination from Santa Maria)
– Net migration: 676 to Santa Maria

Edmund Garman // Flickr
#18. Urban Honolulu, HI Metro Area
– Migration to Urban Honolulu in 2015-2019: 1,548
– Migration from Urban Honolulu to San Diego: 2,003 (#4 most common destination from Urban Honolulu)
– Net migration: 455 to San Diego

Zereshk // Wikimedia
#17. Tucson, AZ Metro Area
– Migration to Tucson in 2015-2019: 1,603
– Migration from Tucson to San Diego: 1,063 (#2 most common destination from Tucson)
– Net migration: 540 to Tucson

skeeze // Pixabay
#16. Houston-The Woodlands-Sugar Land, TX Metro Area
– Migration to Houston in 2015-2019: 1,654
– Migration from Houston to San Diego: 1,013 (#30 most common destination from Houston)
– Net migration: 641 to Houston
You may also like: Highest and lowest paying health care jobs in San Diego

f11photo // Shutterstock
#15. Denver-Aurora-Lakewood, CO Metro Area
– Migration to Denver in 2015-2019: 1,796
– Migration from Denver to San Diego: 1,255 (#18 most common destination from Denver)
– Net migration: 541 to Denver

Christopher & Amy Esposito // Wikicommons
#14. Chicago-Naperville-Elgin, IL-IN-WI Metro Area
– Migration to Chicago in 2015-2019: 1,952
– Migration from Chicago to San Diego: 3,805 (#17 most common destination from Chicago)
– Net migration: 1,853 to San Diego

Pixabay
#13. Sacramento-Roseville-Folsom, CA Metro Area
– Migration to Sacramento in 2015-2019: 1,991
– Migration from Sacramento to San Diego: 2,058 (#8 most common destination from Sacramento)
– Net migration: 67 to San Diego

King of Hearts // Wikimedia
#12. New York-Newark-Jersey City, NY-NJ-PA Metro Area
– Migration to New York in 2015-2019: 2,351
– Migration from New York to San Diego: 3,620 (#33 most common destination from New York)
– Net migration: 1,269 to San Diego

Don Ramey Logan // Wikicommons
#11. San Jose-Sunnyvale-Santa Clara, CA Metro Area
– Migration to San Jose in 2015-2019: 2,591
– Migration from San Jose to San Diego: 2,875 (#7 most common destination from San Jose)
– Net migration: 284 to San Diego
You may also like: Highest-rated breakfast restaurants in San Diego, according to Tripadvisor

randy andy // Shutterstock
#10. Las Vegas-Henderson-Paradise, NV Metro Area
– Migration to Las Vegas in 2015-2019: 2,709
– Migration from Las Vegas to San Diego: 1,757 (#5 most common destination from Las Vegas)
– Net migration: 952 to Las Vegas

Stuart Seeger // Wikicommons
#9. Portland-Vancouver-Hillsboro, OR-WA Metro Area
– Migration to Portland in 2015-2019: 2,803
– Migration from Portland to San Diego: 1,543 (#12 most common destination from Portland)
– Net migration: 1,260 to Portland

Sherry V Smith // Shutterstock
#8. Virginia Beach-Norfolk-Newport News, VA-NC Metro Area
– Migration to Virginia Beach in 2015-2019: 3,013
– Migration from Virginia Beach to San Diego: 3,137 (#3 most common destination from Virginia Beach)
– Net migration: 124 to San Diego

Alan Botting // Wikimedia Commons
#7. Dallas-Fort Worth-Arlington, TX Metro Area
– Migration to Dallas in 2015-2019: 3,095
– Migration from Dallas to San Diego: 1,892 (#23 most common destination from Dallas)
– Net migration: 1,203 to Dallas
Public Domain
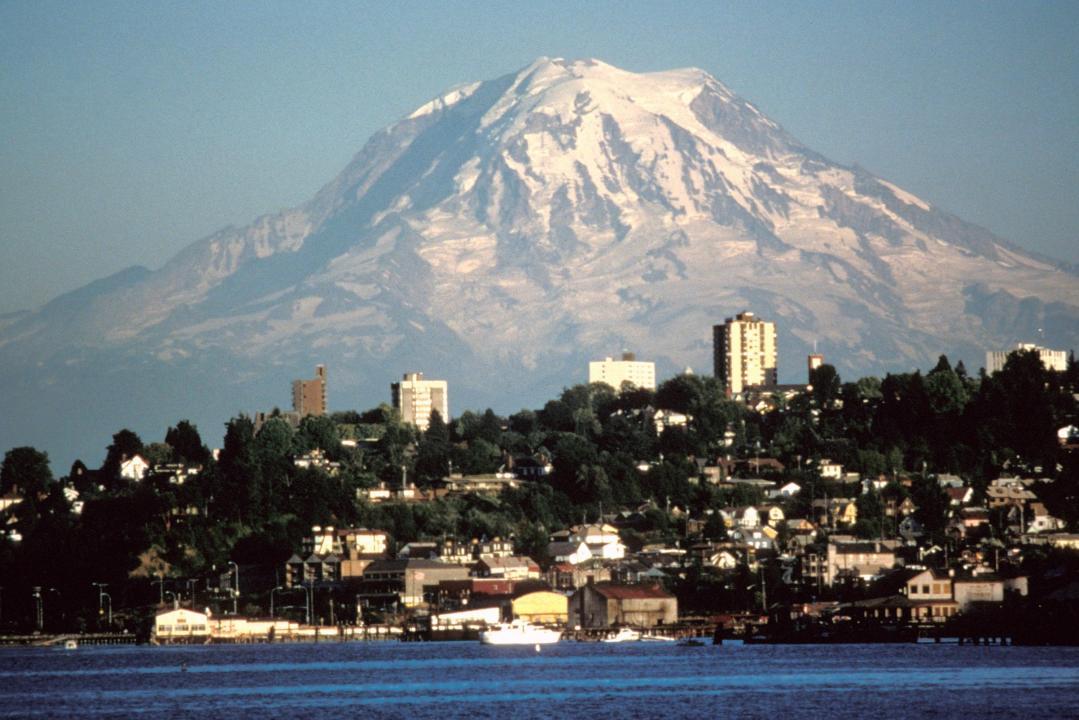
#6. Seattle-Tacoma-Bellevue, WA Metro Area
– Migration to Seattle in 2015-2019: 3,105
– Migration from Seattle to San Diego: 2,407 (#11 most common destination from Seattle)
– Net migration: 698 to Seattle
You may also like: Metros where people in San Diego are getting new jobs

Andrew Bossi // Wikimedia
#5. Washington-Arlington-Alexandria, DC-VA-MD-WV Metro Area
– Migration to Washington in 2015-2019: 3,464
– Migration from Washington to San Diego: 3,936 (#12 most common destination from Washington)
– Net migration: 472 to San Diego

DPPed// Wikimedia
#4. Phoenix-Mesa-Chandler, AZ Metro Area
– Migration to Phoenix in 2015-2019: 5,493
– Migration from Phoenix to San Diego: 2,740 (#11 most common destination from Phoenix)
– Net migration: 2,753 to Phoenix

en:User:Paul.h // Wikimedia
#3. San Francisco-Oakland-Berkeley, CA Metro Area
– Migration to San Francisco in 2015-2019: 6,265
– Migration from San Francisco to San Diego: 5,402 (#8 most common destination from San Francisco)
– Net migration: 863 to San Francisco

BDS2006 // Wikimedia
#2. Los Angeles-Long Beach-Anaheim, CA Metro Area
– Migration to Los Angeles in 2015-2019: 16,420
– Migration from Los Angeles to San Diego: 17,598 (#3 most common destination from Los Angeles)
– Net migration: 1,178 to San Diego

Daniel Orth // Flickr
#1. Riverside-San Bernardino-Ontario, CA Metro Area
– Migration to Riverside in 2015-2019: 20,455
– Migration from Riverside to San Diego: 12,910 (#2 most common destination from Riverside)
– Net migration: 7,545 to Riverside
You may also like: Zip codes with the most expensive homes in San Diego metro area