Biggest sources of immigrants to Phoenix
User:Colin // Wikimedia Commons
Biggest sources of immigrants to Phoenix
Nearly 14% of the United States population is composed of immigrants. But in reality, the vast majority of Americans today are here because of relatives who immigrated from other countries some time in the last several hundred years.
And while the distinctive American culture and spirit is the result of blending many diverse cultures and histories, the United States has for centuries had an up-and-down relationship with immigration.
Each era of immigration has been met with reductive ideas and resistance, whether the backlash was directed toward the Chinese, Irish, Italians, or Mexicans. Immigration laws have targeted specific groups at various times, stoking intolerance and preventing people from truly joining American society. Over time, however, as laws changed to be more equitable and immigrants found their footings, we have reaped the rewards of innovation in business, music, art, literature, dance, food, societal norms, entertainment, and sports—all while realizing a greater understanding of and respect for different cultures, religions, and ideas.
Stacker compiled a list of the countries most immigrants to Phoenix come from, using data from the U.S. Census Bureau. Countries are ranked by highest number of foreign-born residents who lived in Phoenix as of 2019’s five-year estimates.
Keep reading to find out more about the immigrant community in your home city.
![]()

Unsplash
#50. Ukraine
Phoenix-Mesa-Chandler, AZ Metro Area
– Number of residents: 1,335
– Percent of foreign born residents: 0.2%
National
– Number of residents: 345,250
– Percent of foreign born residents: 0.8%
– #28 most common country of origin
Creativa Images // Shutterstock
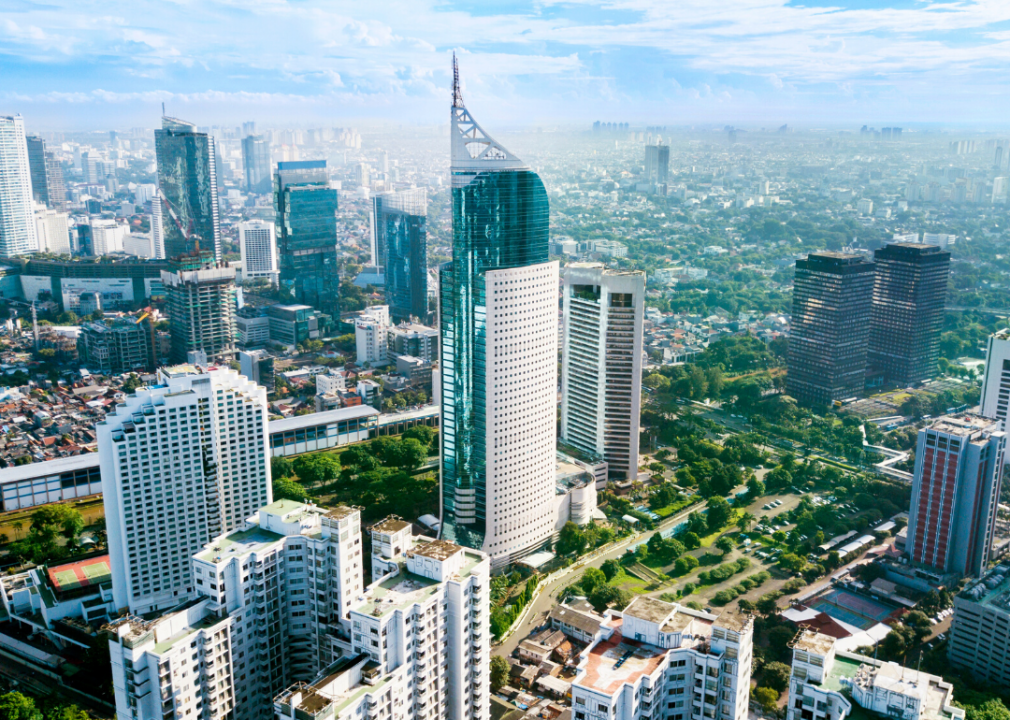
#49. Indonesia
Phoenix-Mesa-Chandler, AZ Metro Area
– Number of residents: 1,346
– Percent of foreign born residents: 0.2%
National
– Number of residents: 96,229
– Percent of foreign born residents: 0.2%
– #62 most common country of origin

Evgeniya Uvarova // Shutterstock
#48. Argentina
Phoenix-Mesa-Chandler, AZ Metro Area
– Number of residents: 1,361
– Percent of foreign born residents: 0.2%
National
– Number of residents: 194,435
– Percent of foreign born residents: 0.4%
– #39 most common country of origin

Elena Simona Craciun // Shutterstock
#47. Nicaragua
Phoenix-Mesa-Chandler, AZ Metro Area
– Number of residents: 1,406
– Percent of foreign born residents: 0.2%
National
– Number of residents: 251,913
– Percent of foreign born residents: 0.6%
– #33 most common country of origin
Fitria Ramli // Shutterstock
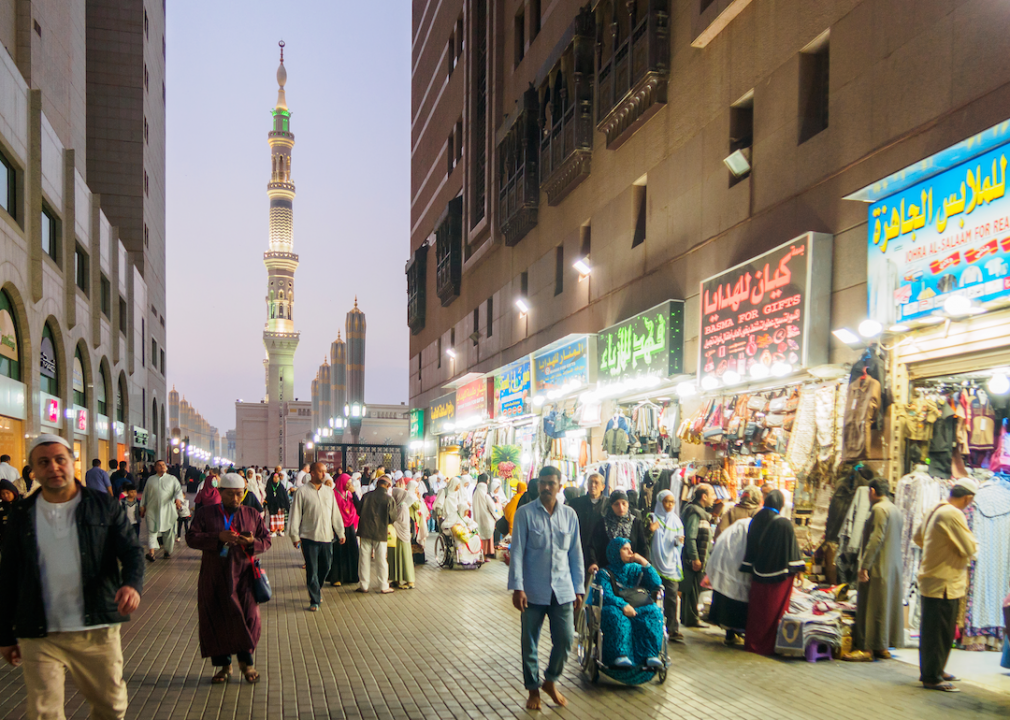
#46. Saudi Arabia
Phoenix-Mesa-Chandler, AZ Metro Area
– Number of residents: 1,414
– Percent of foreign born residents: 0.2%
National
– Number of residents: 85,000
– Percent of foreign born residents: 0.2%
– #70 most common country of origin
Dave Primov // Shutterstock
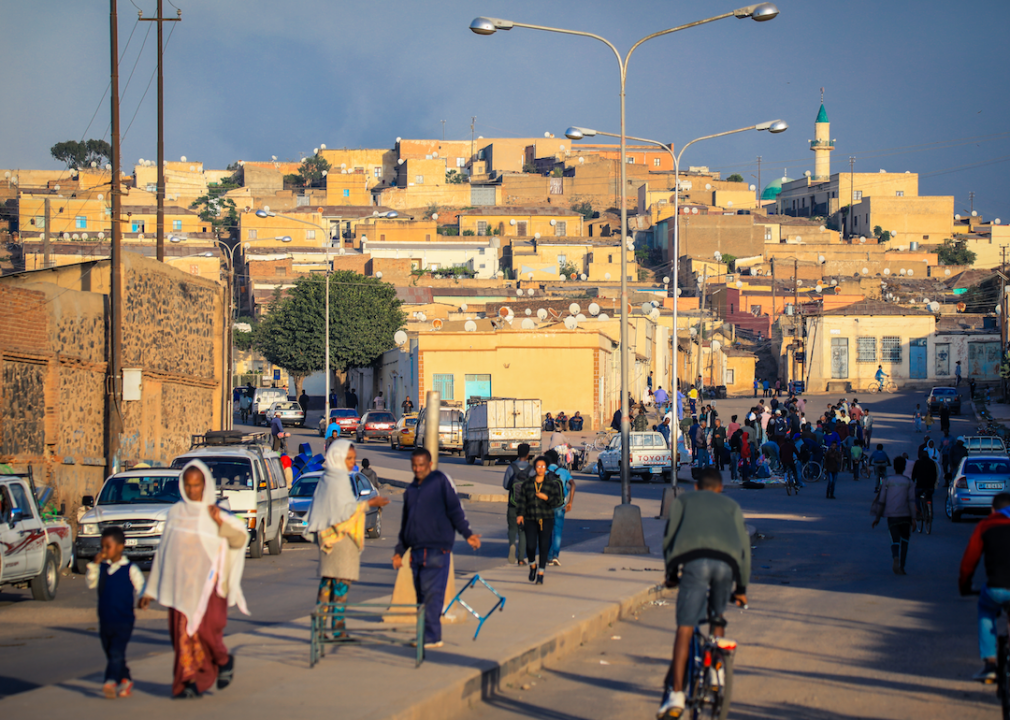
#45. Eritrea
Phoenix-Mesa-Chandler, AZ Metro Area
– Number of residents: 1,417
– Percent of foreign born residents: 0.2%
National
– Number of residents: 45,119
– Percent of foreign born residents: 0.1%
– #90 most common country of origin
Michael Shade // Wikicommons
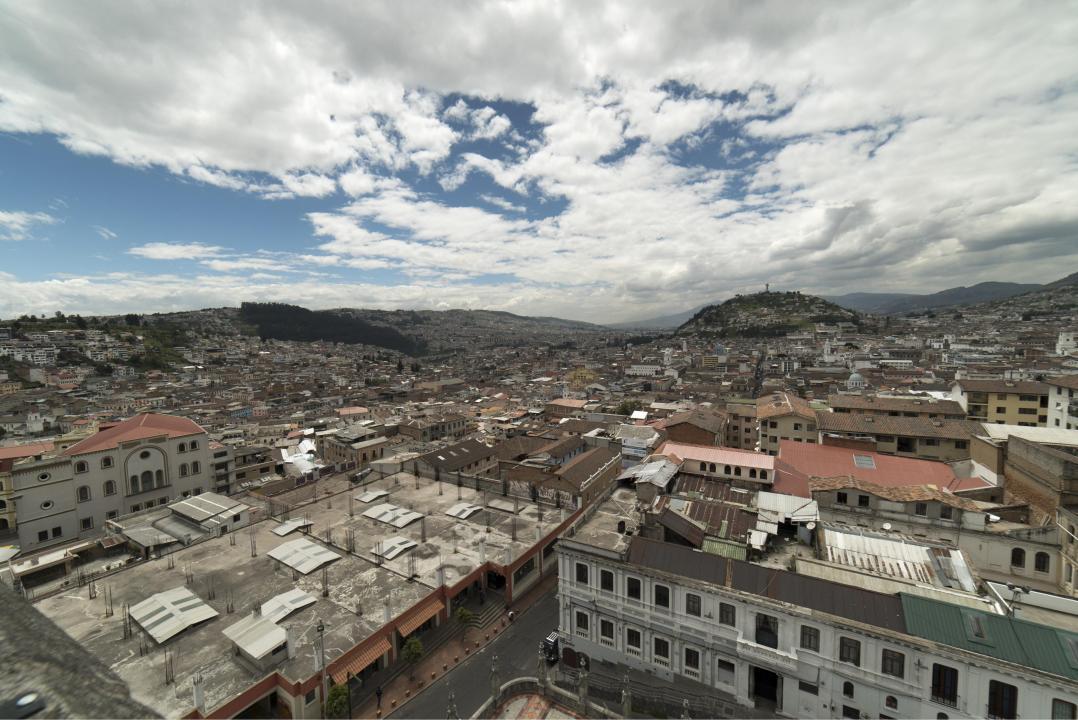
#44. Ecuador
Phoenix-Mesa-Chandler, AZ Metro Area
– Number of residents: 1,462
– Percent of foreign born residents: 0.2%
National
– Number of residents: 438,474
– Percent of foreign born residents: 1.0%
– #19 most common country of origin

byvalet // Shutterstock
#43. Jamaica
Phoenix-Mesa-Chandler, AZ Metro Area
– Number of residents: 1,477
– Percent of foreign born residents: 0.2%
National
– Number of residents: 741,386
– Percent of foreign born residents: 1.7%
– #13 most common country of origin

Maryam // Wikicommons
#42. Kuwait
Phoenix-Mesa-Chandler, AZ Metro Area
– Number of residents: 1,535
– Percent of foreign born residents: 0.2%
National
– Number of residents: 33,788
– Percent of foreign born residents: 0.1%
– #102 most common country of origin

Pixabay
#41. Netherlands
Phoenix-Mesa-Chandler, AZ Metro Area
– Number of residents: 1,584
– Percent of foreign born residents: 0.2%
National
– Number of residents: 85,161
– Percent of foreign born residents: 0.2%
– #69 most common country of origin
Bernard Gagnon // Wikimedia Commons
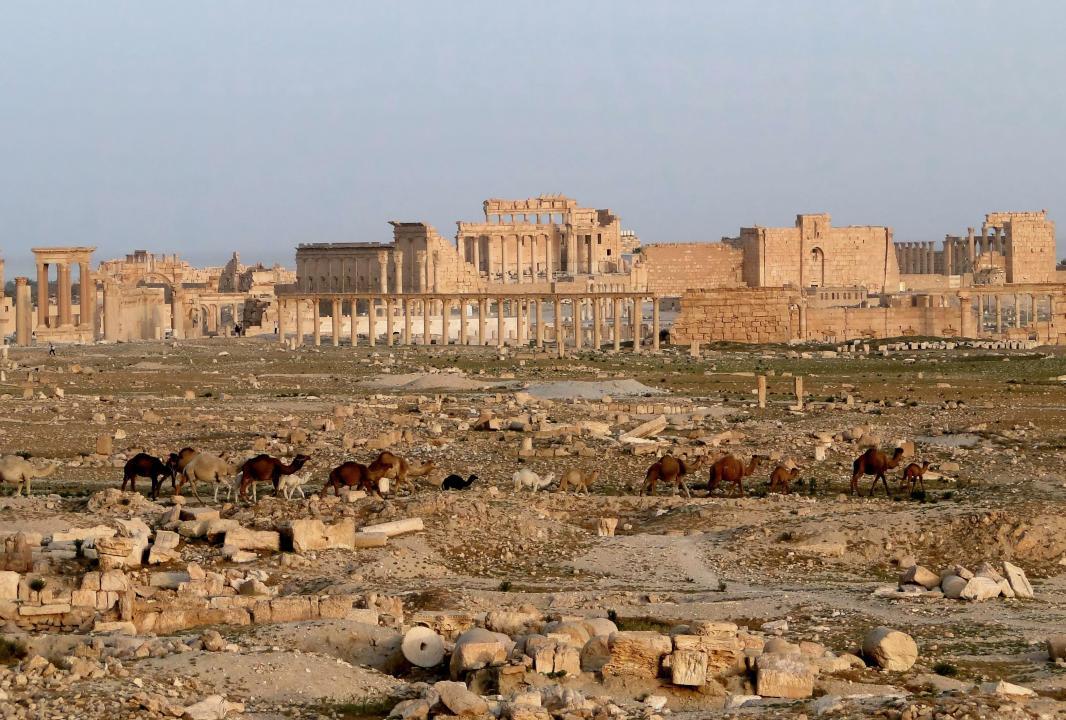
#40. Syria
Phoenix-Mesa-Chandler, AZ Metro Area
– Number of residents: 1,595
– Percent of foreign born residents: 0.2%
National
– Number of residents: 95,802
– Percent of foreign born residents: 0.2%
– #63 most common country of origin
Denys Yelmanov // Shutterstock
#39. Bangladesh
Phoenix-Mesa-Chandler, AZ Metro Area
– Number of residents: 1,654
– Percent of foreign born residents: 0.2%
National
– Number of residents: 237,288
– Percent of foreign born residents: 0.5%
– #35 most common country of origin
Diego Delso // Wikimedia Commons
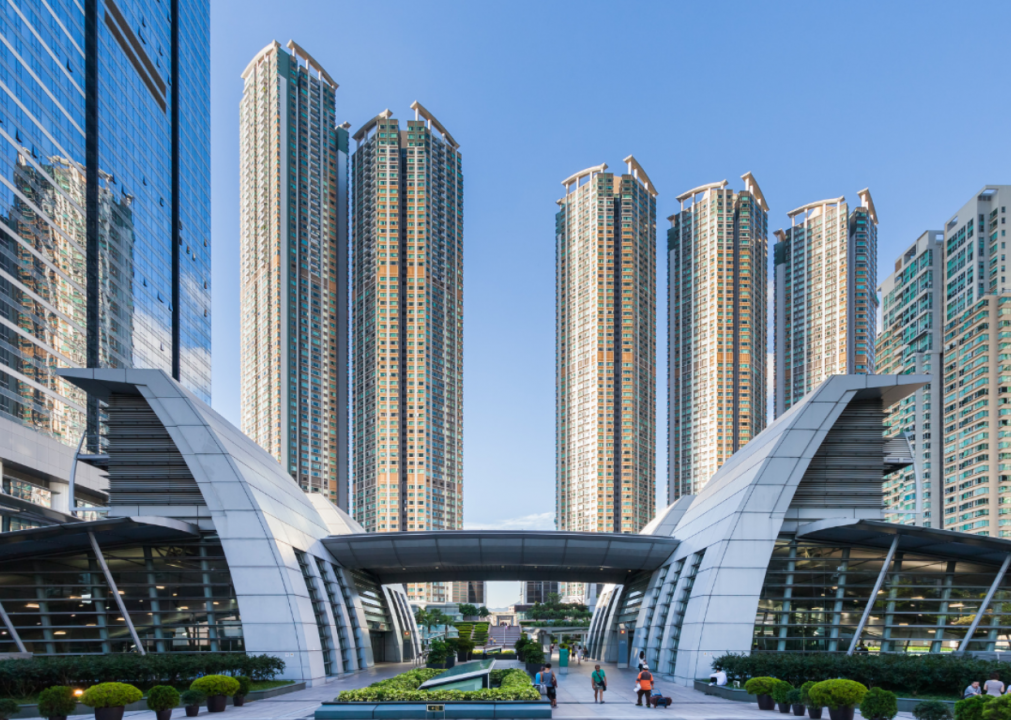
#38. Hong Kong
Phoenix-Mesa-Chandler, AZ Metro Area
– Number of residents: 1,679
– Percent of foreign born residents: 0.2%
National
– Number of residents: 231,275
– Percent of foreign born residents: 0.5%
– #36 most common country of origin
Wikimedia Commons
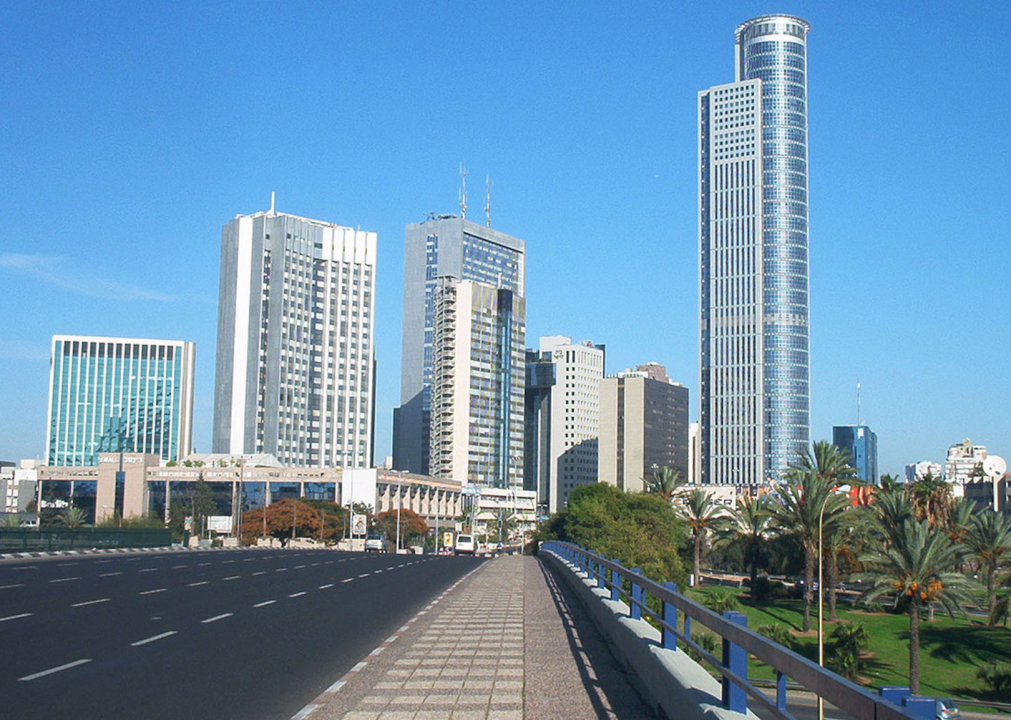
#37. Israel
Phoenix-Mesa-Chandler, AZ Metro Area
– Number of residents: 1,691
– Percent of foreign born residents: 0.2%
National
– Number of residents: 135,672
– Percent of foreign born residents: 0.3%
– #50 most common country of origin
GoodFreePhotos
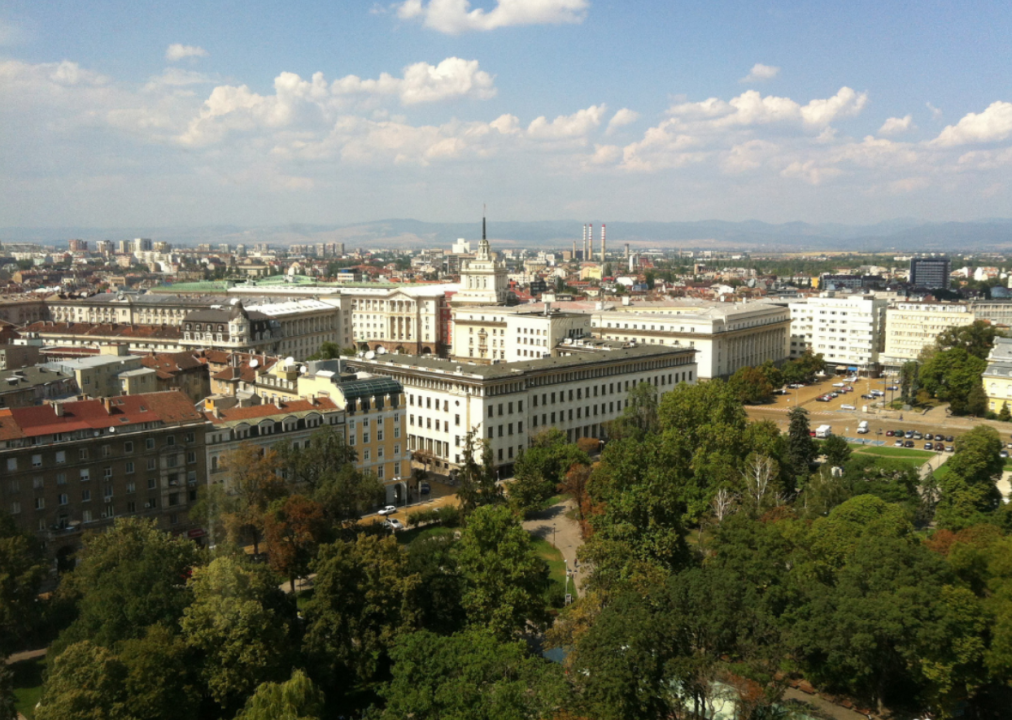
#36. Bulgaria
Phoenix-Mesa-Chandler, AZ Metro Area
– Number of residents: 1,705
– Percent of foreign born residents: 0.3%
National
– Number of residents: 69,765
– Percent of foreign born residents: 0.2%
– #75 most common country of origin

agchinook // Shutterstock
#35. Venezuela
Phoenix-Mesa-Chandler, AZ Metro Area
– Number of residents: 1,713
– Percent of foreign born residents: 0.3%
National
– Number of residents: 349,720
– Percent of foreign born residents: 0.8%
– #27 most common country of origin

Michal Knitl // Shutterstock
#34. Afghanistan
Phoenix-Mesa-Chandler, AZ Metro Area
– Number of residents: 1,744
– Percent of foreign born residents: 0.3%
National
– Number of residents: 101,548
– Percent of foreign born residents: 0.2%
– #59 most common country of origin
Saqib Rizvi // Shutterstock
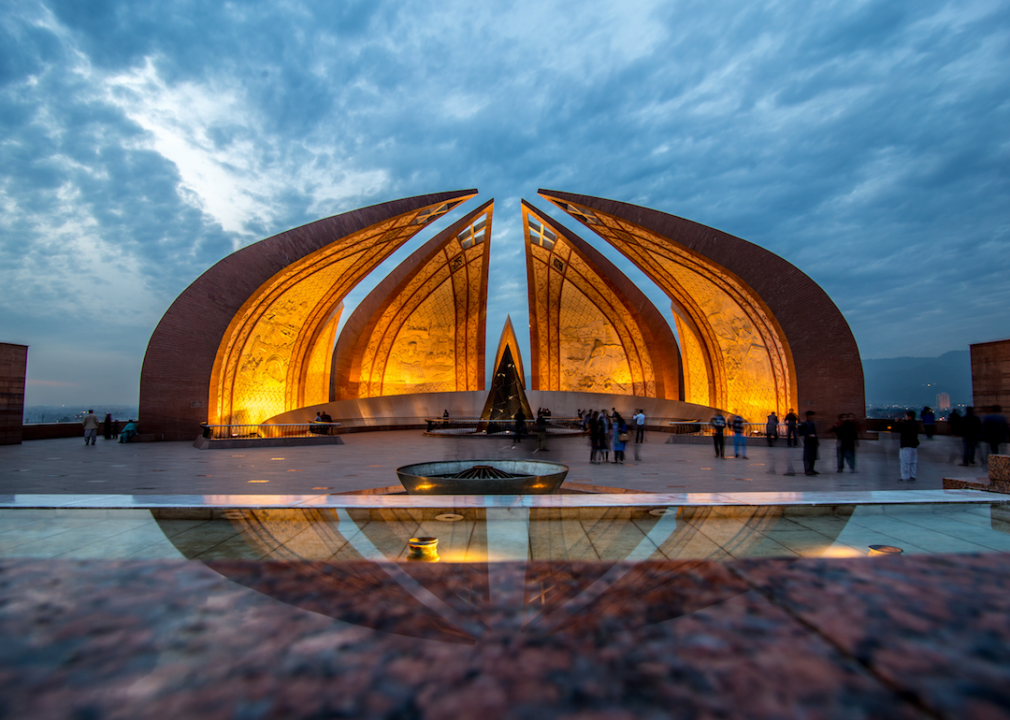
#33. Pakistan
Phoenix-Mesa-Chandler, AZ Metro Area
– Number of residents: 1,805
– Percent of foreign born residents: 0.3%
National
– Number of residents: 376,127
– Percent of foreign born residents: 0.9%
– #25 most common country of origin

Photos By Beks // Unsplash
#32. Kenya
Phoenix-Mesa-Chandler, AZ Metro Area
– Number of residents: 1,812
– Percent of foreign born residents: 0.3%
National
– Number of residents: 141,751
– Percent of foreign born residents: 0.3%
– #48 most common country of origin
neiljs // Flickr
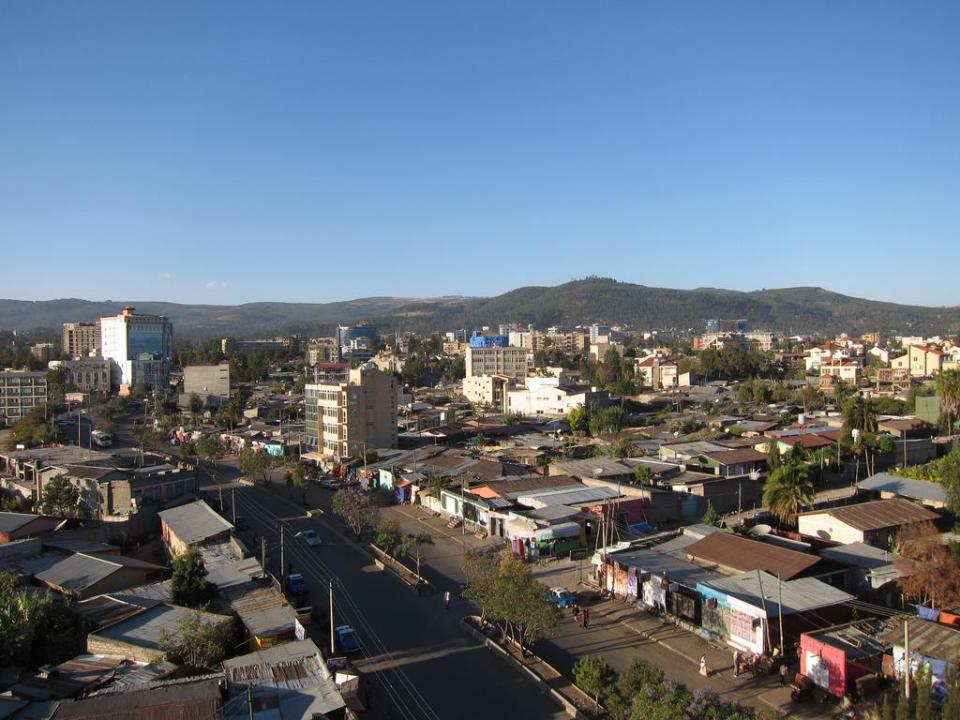
#31. Ethiopia
Phoenix-Mesa-Chandler, AZ Metro Area
– Number of residents: 1,968
– Percent of foreign born residents: 0.3%
National
– Number of residents: 249,777
– Percent of foreign born residents: 0.6%
– #34 most common country of origin

Cheng Qian // Unsplash
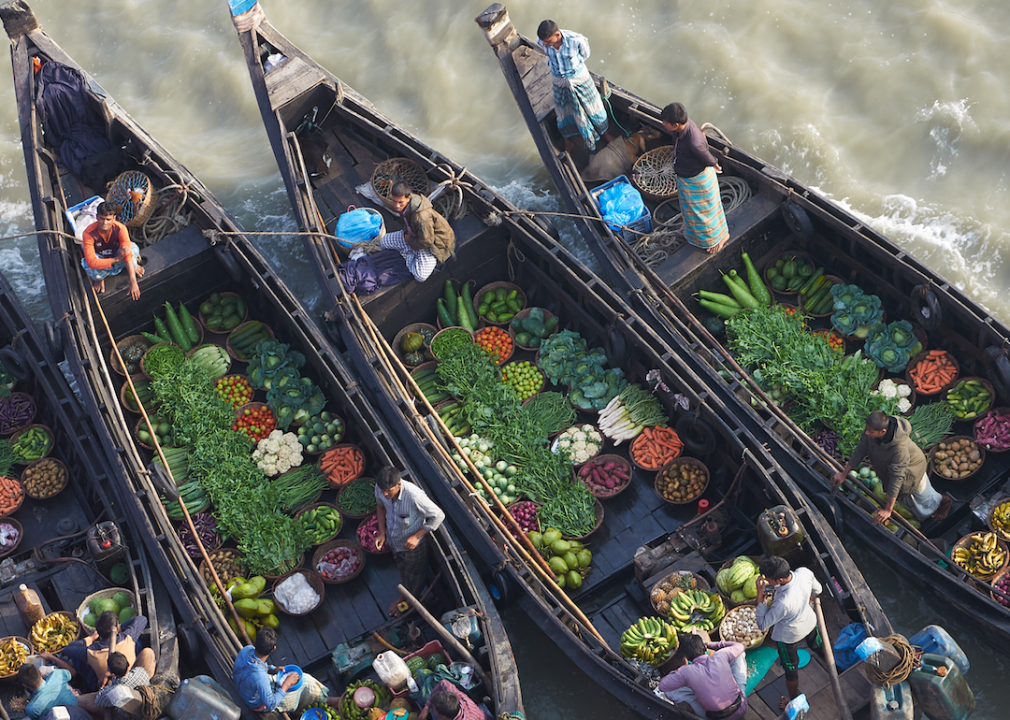
#30. Burma
Phoenix-Mesa-Chandler, AZ Metro Area
– Number of residents: 2,041
– Percent of foreign born residents: 0.3%
National
– Number of residents: 147,573
– Percent of foreign born residents: 0.3%
– #47 most common country of origin

Catarina Belova // Shutterstock
#29. Brazil
Phoenix-Mesa-Chandler, AZ Metro Area
– Number of residents: 2,214
– Percent of foreign born residents: 0.3%
National
– Number of residents: 433,479
– Percent of foreign born residents: 1.0%
– #20 most common country of origin

HandmadePictures // Shutterstock
#28. South Africa
Phoenix-Mesa-Chandler, AZ Metro Area
– Number of residents: 2,219
– Percent of foreign born residents: 0.3%
National
– Number of residents: 104,022
– Percent of foreign born residents: 0.2%
– #56 most common country of origin

Tupungato // Shutterstock
#27. France
Phoenix-Mesa-Chandler, AZ Metro Area
– Number of residents: 2,359
– Percent of foreign born residents: 0.3%
National
– Number of residents: 181,554
– Percent of foreign born residents: 0.4%
– #41 most common country of origin

OpenUpEd // Flickr
#26. Nigeria
Phoenix-Mesa-Chandler, AZ Metro Area
– Number of residents: 2,563
– Percent of foreign born residents: 0.4%
National
– Number of residents: 350,272
– Percent of foreign born residents: 0.8%
– #26 most common country of origin
Christian Vinces // Shutterstock
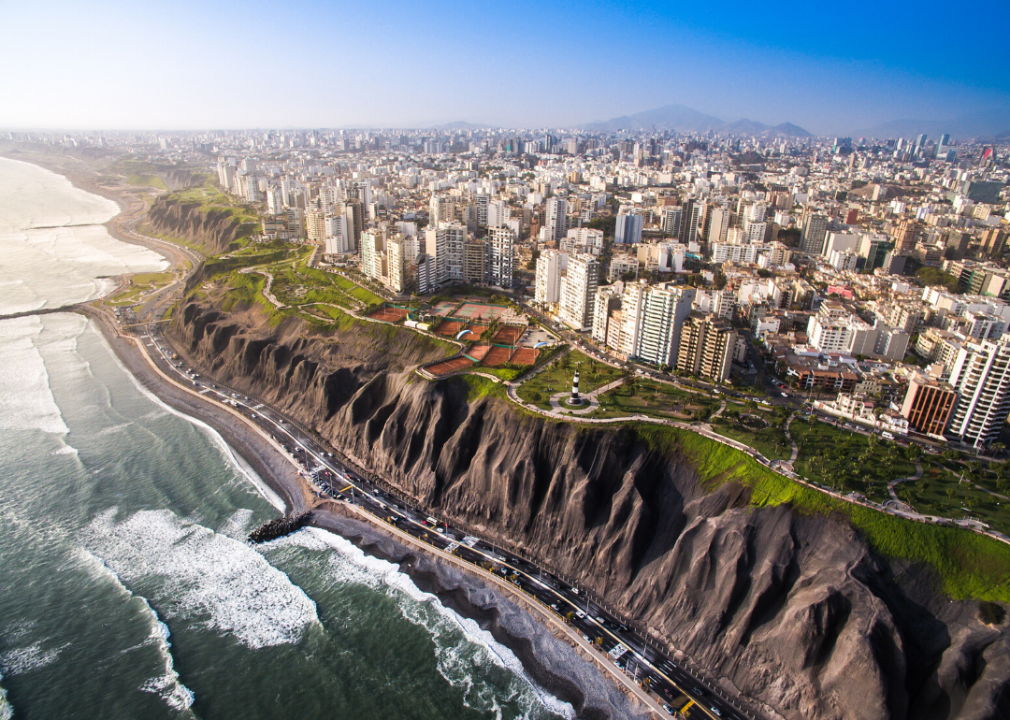
#25. Peru
Phoenix-Mesa-Chandler, AZ Metro Area
– Number of residents: 2,711
– Percent of foreign born residents: 0.4%
National
– Number of residents: 451,076
– Percent of foreign born residents: 1.0%
– #18 most common country of origin
Viacheslav Lopatin // Shutterstock
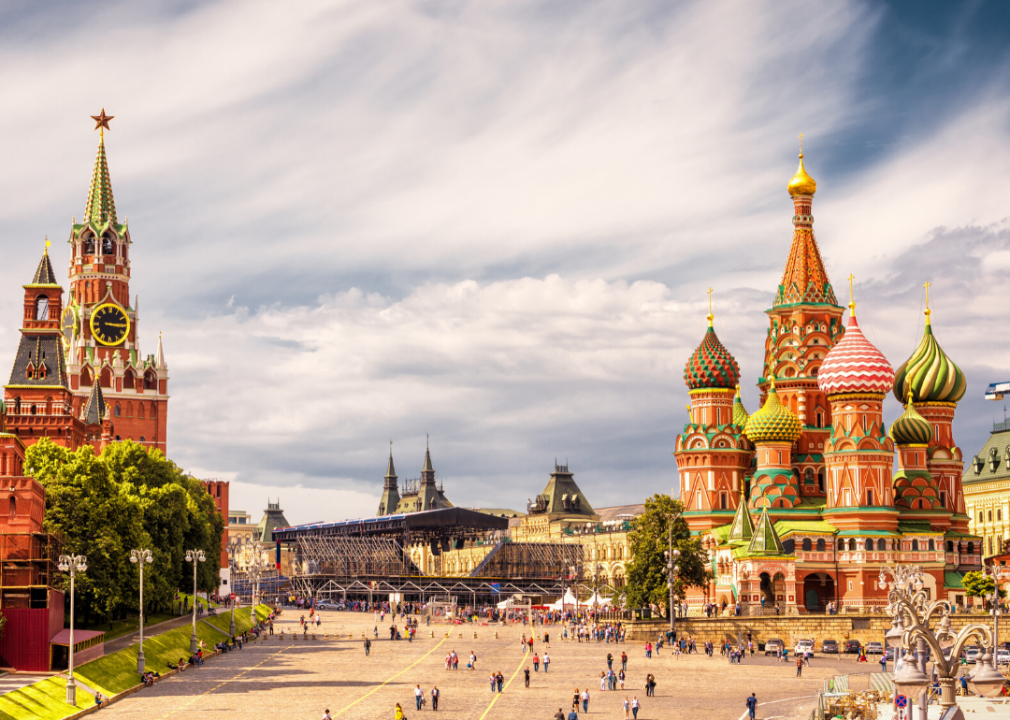
#24. Russia
Phoenix-Mesa-Chandler, AZ Metro Area
– Number of residents: 3,074
– Percent of foreign born residents: 0.5%
National
– Number of residents: 391,641
– Percent of foreign born residents: 0.9%
– #22 most common country of origin

Jack Bkk // Shutterstock
#23. Thailand
Phoenix-Mesa-Chandler, AZ Metro Area
– Number of residents: 3,136
– Percent of foreign born residents: 0.5%
National
– Number of residents: 255,345
– Percent of foreign born residents: 0.6%
– #32 most common country of origin
Marek Poplawski // Shutterstock
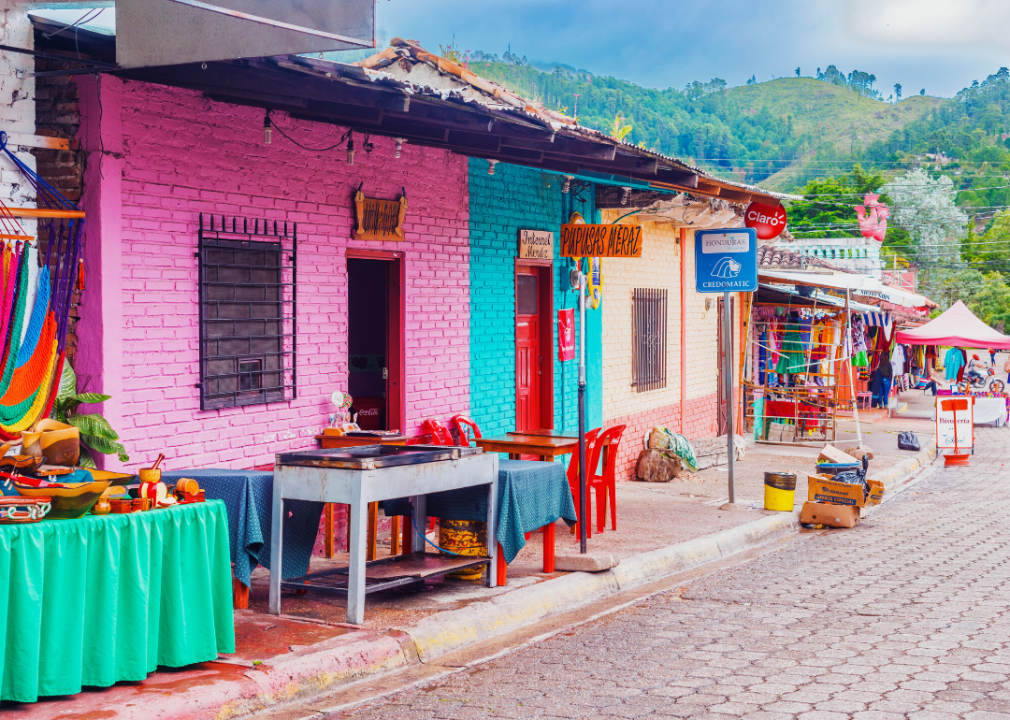
#22. Honduras
Phoenix-Mesa-Chandler, AZ Metro Area
– Number of residents: 3,155
– Percent of foreign born residents: 0.5%
National
– Number of residents: 651,123
– Percent of foreign born residents: 1.5%
– #16 most common country of origin

neshom // Pixabay
#21. Bosnia and Herzegovina
Phoenix-Mesa-Chandler, AZ Metro Area
– Number of residents: 3,216
– Percent of foreign born residents: 0.5%
National
– Number of residents: 103,938
– Percent of foreign born residents: 0.2%
– #57 most common country of origin

Pixabay
#20. Italy
Phoenix-Mesa-Chandler, AZ Metro Area
– Number of residents: 3,224
– Percent of foreign born residents: 0.5%
National
– Number of residents: 332,857
– Percent of foreign born residents: 0.8%
– #30 most common country of origin

PIxabay
#19. Taiwan
Phoenix-Mesa-Chandler, AZ Metro Area
– Number of residents: 3,298
– Percent of foreign born residents: 0.5%
National
– Number of residents: 381,098
– Percent of foreign born residents: 0.9%
– #24 most common country of origin
Unsplash
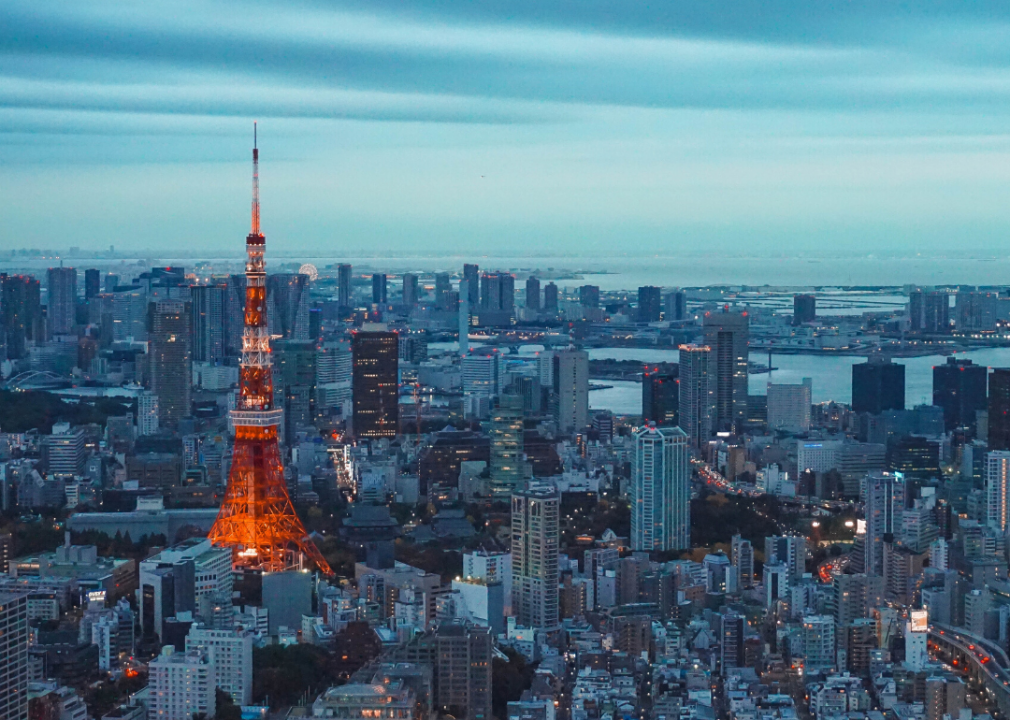
#18. Japan
Phoenix-Mesa-Chandler, AZ Metro Area
– Number of residents: 3,846
– Percent of foreign born residents: 0.6%
National
– Number of residents: 345,140
– Percent of foreign born residents: 0.8%
– #29 most common country of origin
Alexander Canas Arango // Shutterstock
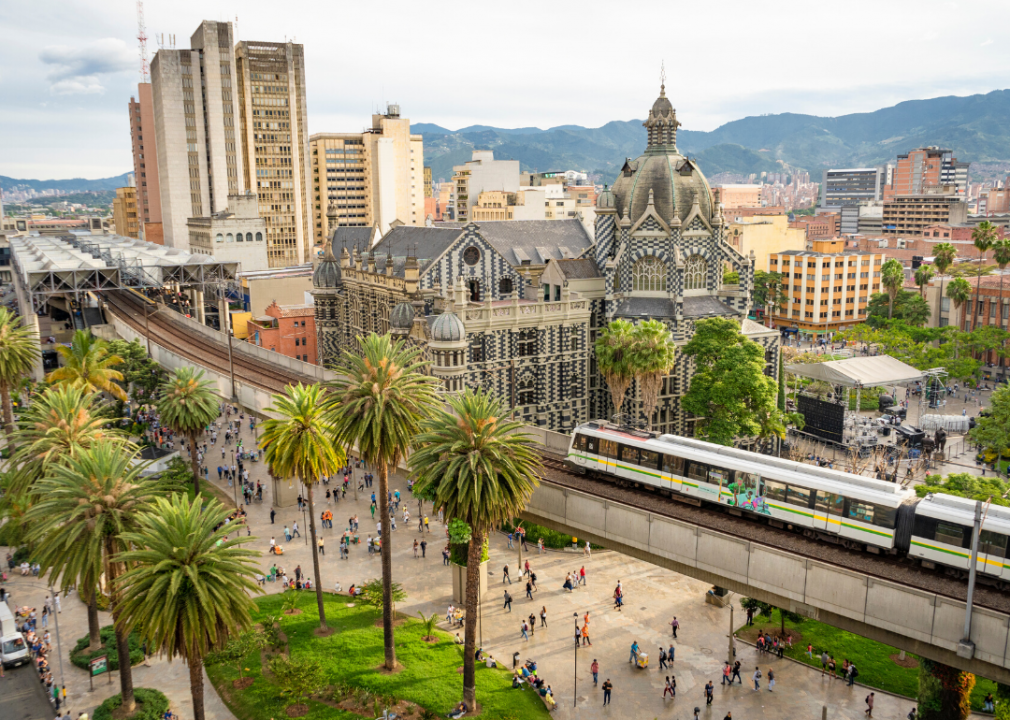
#17. Colombia
Phoenix-Mesa-Chandler, AZ Metro Area
– Number of residents: 3,897
– Percent of foreign born residents: 0.6%
National
– Number of residents: 761,374
– Percent of foreign born residents: 1.7%
– #12 most common country of origin

Nahlik // Shutterstock
#16. Poland
Phoenix-Mesa-Chandler, AZ Metro Area
– Number of residents: 4,442
– Percent of foreign born residents: 0.7%
National
– Number of residents: 410,841
– Percent of foreign born residents: 0.9%
– #21 most common country of origin

Ninara // Wikimedia Commons
#15. Iran
Phoenix-Mesa-Chandler, AZ Metro Area
– Number of residents: 5,327
– Percent of foreign born residents: 0.8%
National
– Number of residents: 382,260
– Percent of foreign born residents: 0.9%
– #23 most common country of origin

Augustin Lazaroiu // Shutterstock
#14. Romania
Phoenix-Mesa-Chandler, AZ Metro Area
– Number of residents: 5,414
– Percent of foreign born residents: 0.8%
National
– Number of residents: 162,046
– Percent of foreign born residents: 0.4%
– #45 most common country of origin
Falkenpost // Pixabay
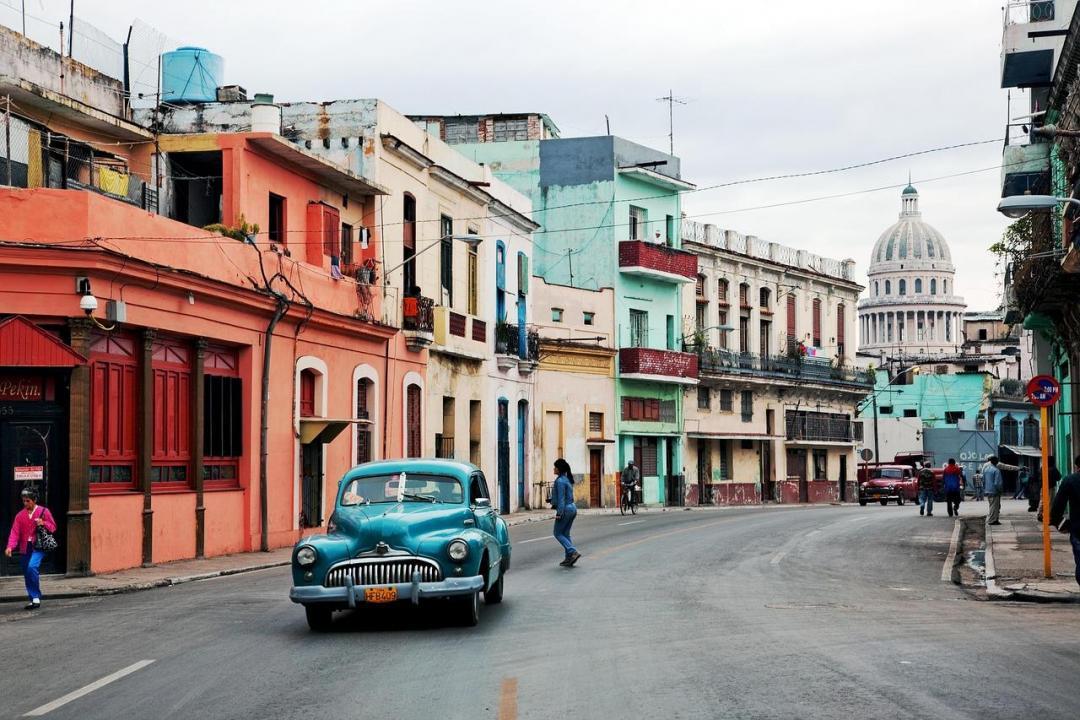
#13. Cuba
Phoenix-Mesa-Chandler, AZ Metro Area
– Number of residents: 6,424
– Percent of foreign born residents: 0.9%
National
– Number of residents: 1,289,875
– Percent of foreign born residents: 2.9%
– #7 most common country of origin
JMRAFFi // Wikimedia Commons
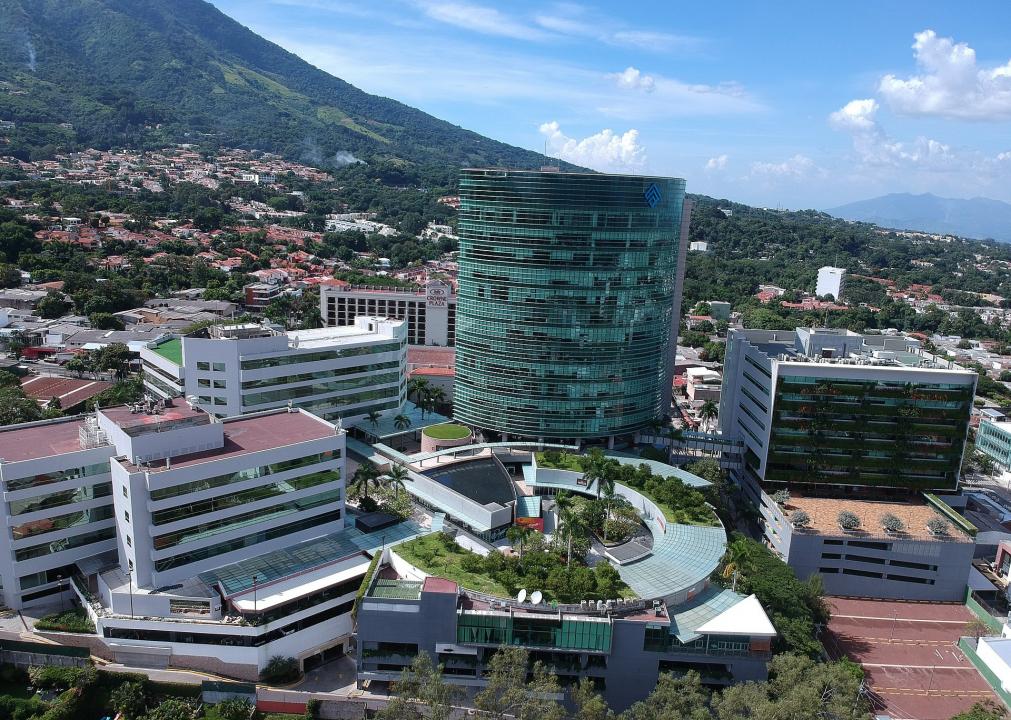
#12. El Salvador
Phoenix-Mesa-Chandler, AZ Metro Area
– Number of residents: 7,443
– Percent of foreign born residents: 1.1%
National
– Number of residents: 1,381,008
– Percent of foreign born residents: 3.1%
– #5 most common country of origin

Kys951 // Wikimedia Commons
#11. South Korea
Phoenix-Mesa-Chandler, AZ Metro Area
– Number of residents: 7,661
– Percent of foreign born residents: 1.1%
National
– Number of residents: 1,044,634
– Percent of foreign born residents: 2.4%
– #9 most common country of origin
Max Pixel
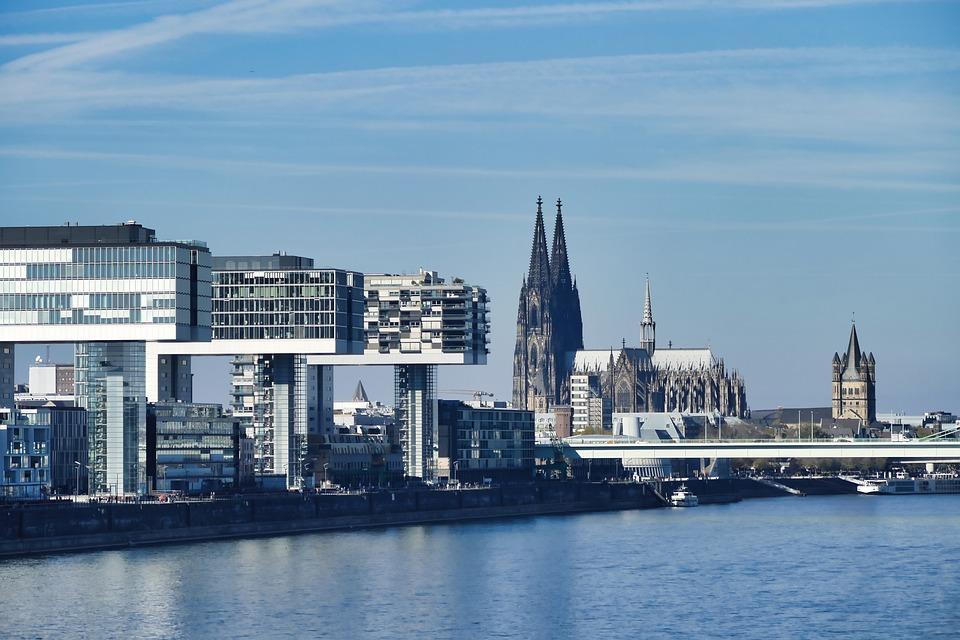
#10. Germany
Phoenix-Mesa-Chandler, AZ Metro Area
– Number of residents: 9,211
– Percent of foreign born residents: 1.4%
National
– Number of residents: 560,368
– Percent of foreign born residents: 1.3%
– #17 most common country of origin

USACE HQ , JIM GORDAN, CIV, USACE // Wikicommons
#9. Iraq
Phoenix-Mesa-Chandler, AZ Metro Area
– Number of residents: 9,986
– Percent of foreign born residents: 1.5%
National
– Number of residents: 225,038
– Percent of foreign born residents: 0.5%
– #38 most common country of origin

User:Colin // Wikimedia Commons
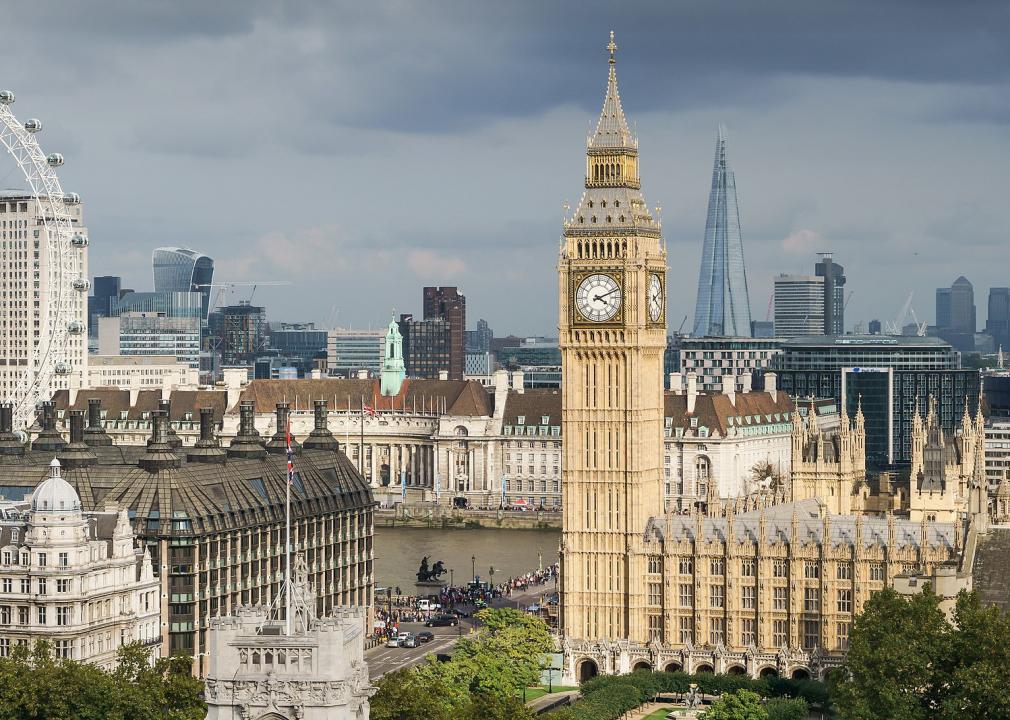
#8. United Kingdom
Phoenix-Mesa-Chandler, AZ Metro Area
– Number of residents: 11,905
– Percent of foreign born residents: 1.7%
National
– Number of residents: 698,612
– Percent of foreign born residents: 1.6%
– #14 most common country of origin
Kobby Dagan // Shutterstock
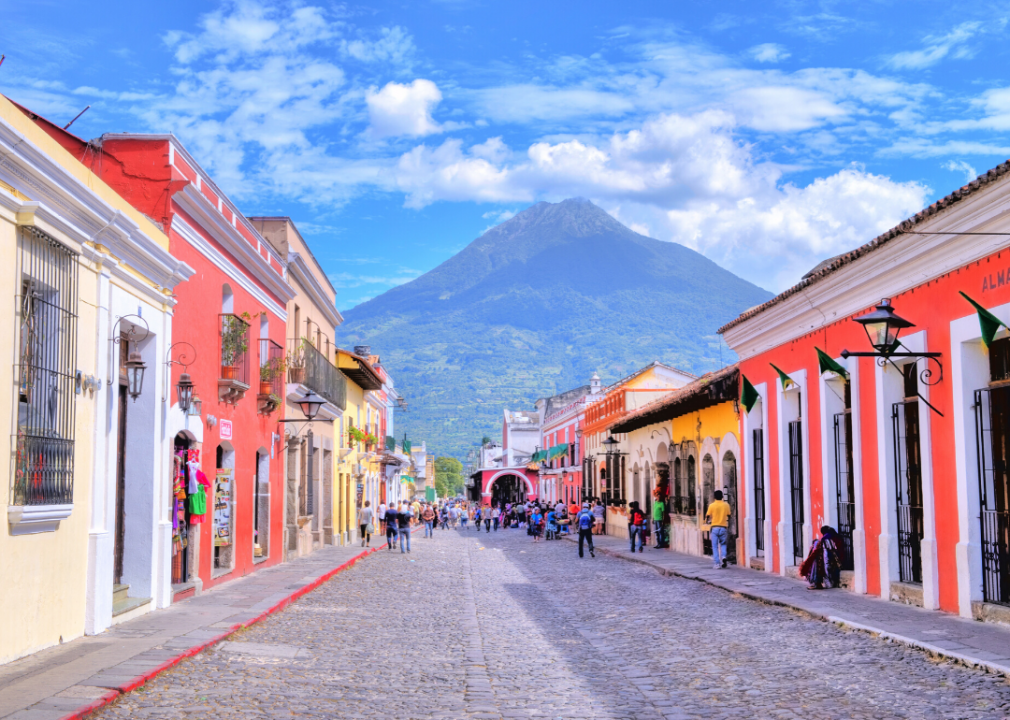
#7. Guatemala
Phoenix-Mesa-Chandler, AZ Metro Area
– Number of residents: 12,633
– Percent of foreign born residents: 1.9%
National
– Number of residents: 979,098
– Percent of foreign born residents: 2.2%
– #10 most common country of origin

Quangpraha // Pixabay
#6. Vietnam
Phoenix-Mesa-Chandler, AZ Metro Area
– Number of residents: 16,708
– Percent of foreign born residents: 2.5%
National
– Number of residents: 1,336,988
– Percent of foreign born residents: 3.0%
– #6 most common country of origin

Sean Pavone // Shutterstock
#5. China
Phoenix-Mesa-Chandler, AZ Metro Area
– Number of residents: 17,110
– Percent of foreign born residents: 2.5%
National
– Number of residents: 2,162,395
– Percent of foreign born residents: 4.9%
– #3 most common country of origin

Joseph Oropel // Shutterstock
#4. Philippines
Phoenix-Mesa-Chandler, AZ Metro Area
– Number of residents: 25,333
– Percent of foreign born residents: 3.7%
National
– Number of residents: 1,983,939
– Percent of foreign born residents: 4.5%
– #4 most common country of origin

Unsplash
#3. Canada
Phoenix-Mesa-Chandler, AZ Metro Area
– Number of residents: 30,520
– Percent of foreign born residents: 4.5%
National
– Number of residents: 808,566
– Percent of foreign born residents: 1.8%
– #11 most common country of origin

Kriangkrai Thitimakorn // Shutterstock
#2. India
Phoenix-Mesa-Chandler, AZ Metro Area
– Number of residents: 40,135
– Percent of foreign born residents: 5.9%
National
– Number of residents: 2,561,906
– Percent of foreign born residents: 5.8%
– #2 most common country of origin
Jakub Hejtmánek // Wikicommons
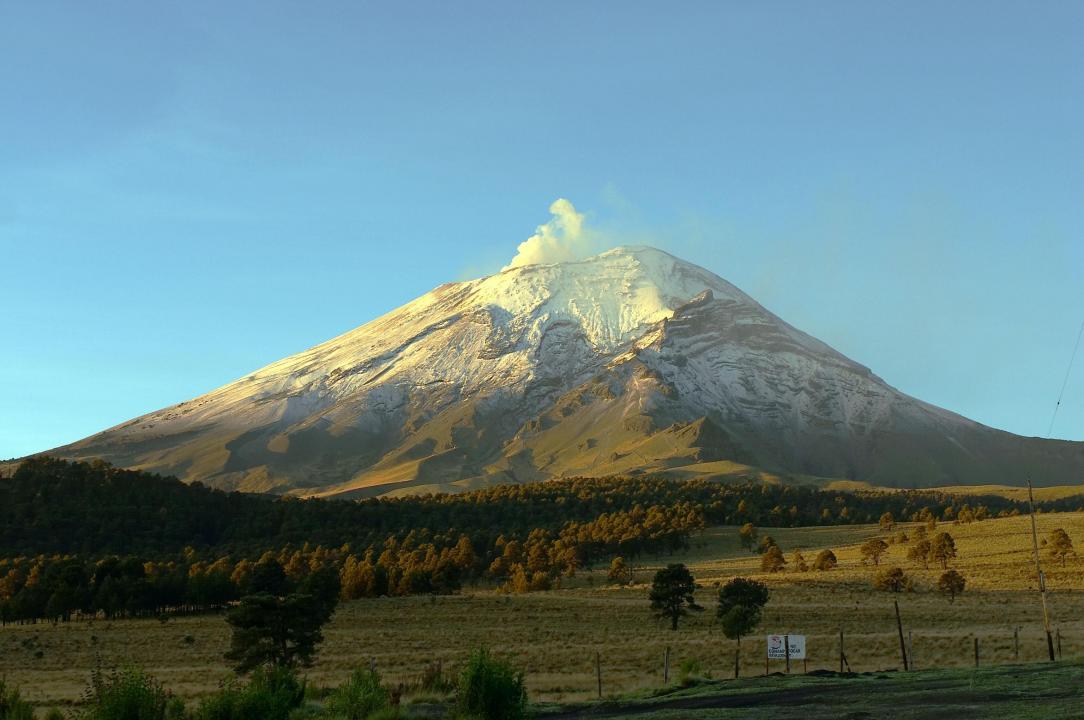
#1. Mexico
Phoenix-Mesa-Chandler, AZ Metro Area
– Number of residents: 343,488
– Percent of foreign born residents: 50.4%
National
– Number of residents: 11,250,541
– Percent of foreign born residents: 25.6%
– #1 most common country of origin