Counties with the highest rate of food insecure children in California

Canva
Counties with the highest rate of food insecure children in California
Food insecurity is a widespread problem in the United States, with people experiencing food insecurity in every single county in the nation. The nonprofit Feeding America describes food insecurity as “a lack of consistent access to enough food for every person in a household to live an active, healthy life.”
Food insecurity hits children particularly hard. The USDA estimates that more than 5.5 million children lived in food-insecure households in 2021. Not having consistent access to enough food can affect cognitive abilities, overall health, moods, and attention spans—not to mention the psychological effects of living with scarcity.
Stacker compiled a list of counties in California with the highest rate of food insecure children using data from Feeding America. Counties are ranked by highest percent of children with food insecurity as of 2020. California has a child food insecurity rate of 13.0%, which ranks #33 highest among all states.
States with the highest rate of food insecure children
#1. Louisiana: 21.5%
#2. New Mexico: 20.5%
#3. Mississippi: 20.4%
#4. Alabama: 19.8%
#5. Arkansas: 19.7%
States with the lowest rate of food insecure children
#1. North Dakota: 8.1%
#2. Massachusetts: 8.8%
#3. New Jersey: 9.0%
#4. Minnesota: 9.3%
#5. New Hampshire: 9.5%
Read on to see where food insecurity is most prevalent in California.
![]()

Kglavin // Wikimedia Commons
#58. Marin County
– Child food insecurity rate: 5.3% (2,760 total)
— 10.8% lower than national average
– Food insecurity rate: 7.5% (19,470 total)
— 4.3% lower than national average
– Annual food budget shortfall: $15,475,000
— Cost per meal: $4.94

Craig Howell // Wikimedia Commons
#57. San Mateo County
– Child food insecurity rate: 5.8% (9,150 total)
— 10.3% lower than national average
– Food insecurity rate: 7.1% (53,990 total)
— 4.7% lower than national average
– Annual food budget shortfall: $37,033,000
— Cost per meal: $4.26

Uladzik Kryhin // Shutterstock
#56. Santa Clara County
– Child food insecurity rate: 6.5% (27,400 total)
— 9.6% lower than national average
– Food insecurity rate: 7.5% (144,140 total)
— 4.3% lower than national average
– Annual food budget shortfall: $95,298,000
— Cost per meal: $4.11

Doug Olson // Wikimedia Commons
#55. Placer County
– Child food insecurity rate: 7.9% (6,860 total)
— 8.2% lower than national average
– Food insecurity rate: 8.0% (31,360 total)
— 3.8% lower than national average
– Annual food budget shortfall: $20,600,000
— Cost per meal: $4.08

Canva
#54. San Francisco
– Child food insecurity rate: 9.1% (10,730 total)
— 7.0% lower than national average
– Food insecurity rate: 11.0% (95,890 total)
— 0.8% lower than national average
– Annual food budget shortfall: $76,010,000
— Cost per meal: $4.92

DimiTalen // Wikimedia Commons
#53. El Dorado County
– Child food insecurity rate: 10.4% (3,930 total)
— 5.7% lower than national average
– Food insecurity rate: 9.5% (18,100 total)
— 2.3% lower than national average
– Annual food budget shortfall: $13,173,000
— Cost per meal: $4.52

Frank Schulenburg // Wikimedia Commons
#52. Nevada County
– Child food insecurity rate: 11.3% (1,930 total)
— 4.8% lower than national average
– Food insecurity rate: 10.3% (10,230 total)
— 1.5% lower than national average
– Annual food budget shortfall: $8,174,000
— Cost per meal: $4.96
Jennifer Williams // Wikimedia Commons
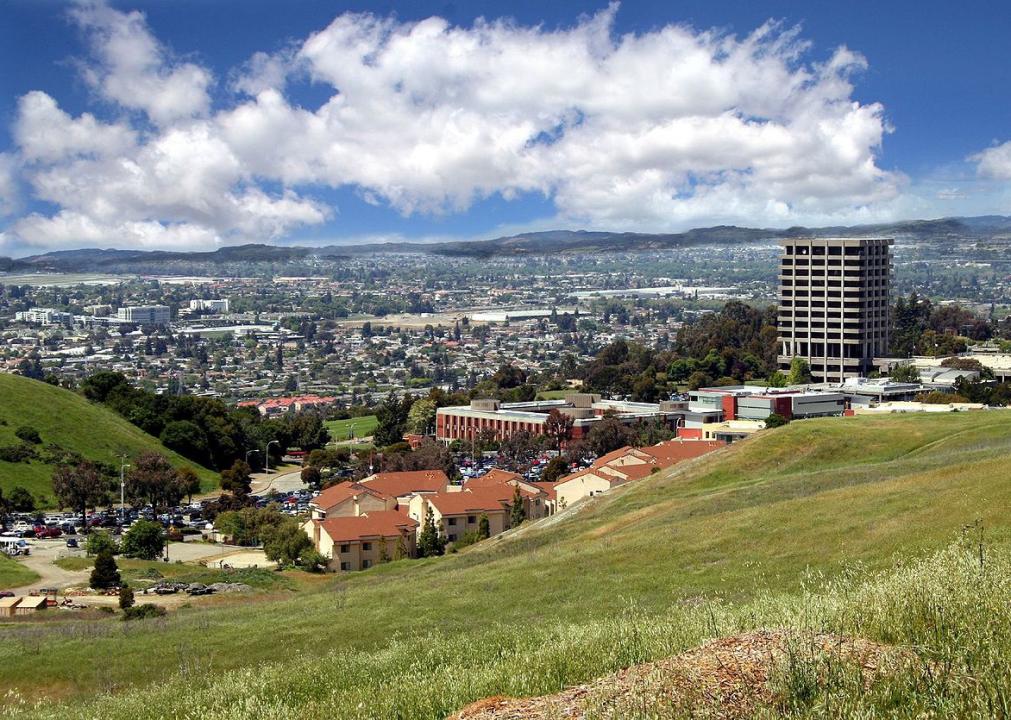
#51. Alameda County
– Child food insecurity rate: 11.4% (39,050 total)
— 4.7% lower than national average
– Food insecurity rate: 9.3% (154,830 total)
— 2.5% lower than national average
– Annual food budget shortfall: $105,872,000
— Cost per meal: $4.25

Basar // Wikicommons
#50. San Luis Obispo County
– Child food insecurity rate: 11.4% (5,670 total)
— 4.7% lower than national average
– Food insecurity rate: 9.1% (25,600 total)
— 2.7% lower than national average
– Annual food budget shortfall: $16,082,000
— Cost per meal: $3.90

MARELBU // Wikimedia Commons
#49. Contra Costa County
– Child food insecurity rate: 11.8% (30,650 total)
— 4.3% lower than national average
– Food insecurity rate: 8.5% (97,160 total)
— 3.3% lower than national average
– Annual food budget shortfall: $64,482,000
— Cost per meal: $4.12

Stan Shebs // Wikicommons
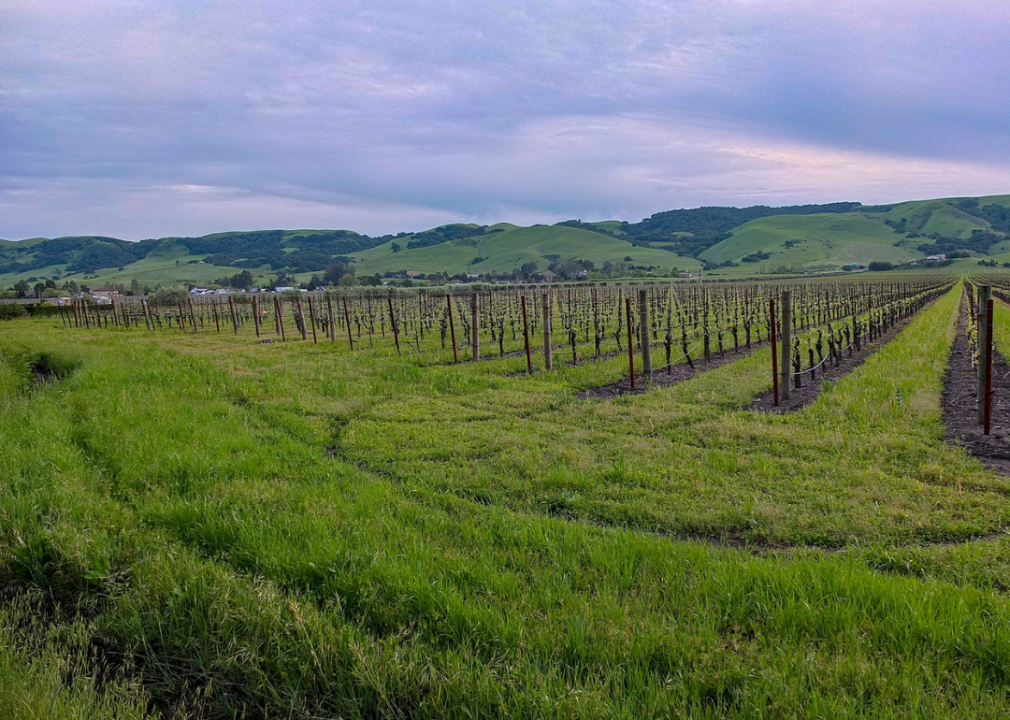
#48. Napa County
– Child food insecurity rate: 12.1% (3,440 total)
— 4.0% lower than national average
– Food insecurity rate: 8.7% (12,070 total)
— 3.1% lower than national average
– Annual food budget shortfall: $8,495,000
— Cost per meal: $4.37
Fred Hsu // Wikicommons
#47. Sonoma County
– Child food insecurity rate: 12.1% (11,820 total)
— 4.0% lower than national average
– Food insecurity rate: 9.3% (46,040 total)
— 2.5% lower than national average
– Annual food budget shortfall: $31,858,000
— Cost per meal: $4.30

Hollywood // Wikimedia Commons
#46. Orange County
– Child food insecurity rate: 12.3% (85,990 total)
— 3.8% lower than national average
– Food insecurity rate: 9.4% (296,470 total)
— 2.4% lower than national average
– Annual food budget shortfall: $180,052,000
— Cost per meal: $3.77

Epolk // Wikimedia Commons
#45. Yolo County
– Child food insecurity rate: 12.4% (5,710 total)
— 3.7% lower than national average
– Food insecurity rate: 10.6% (23,210 total)
— 1.2% lower than national average
– Annual food budget shortfall: $13,646,000
— Cost per meal: $3.65
Canva
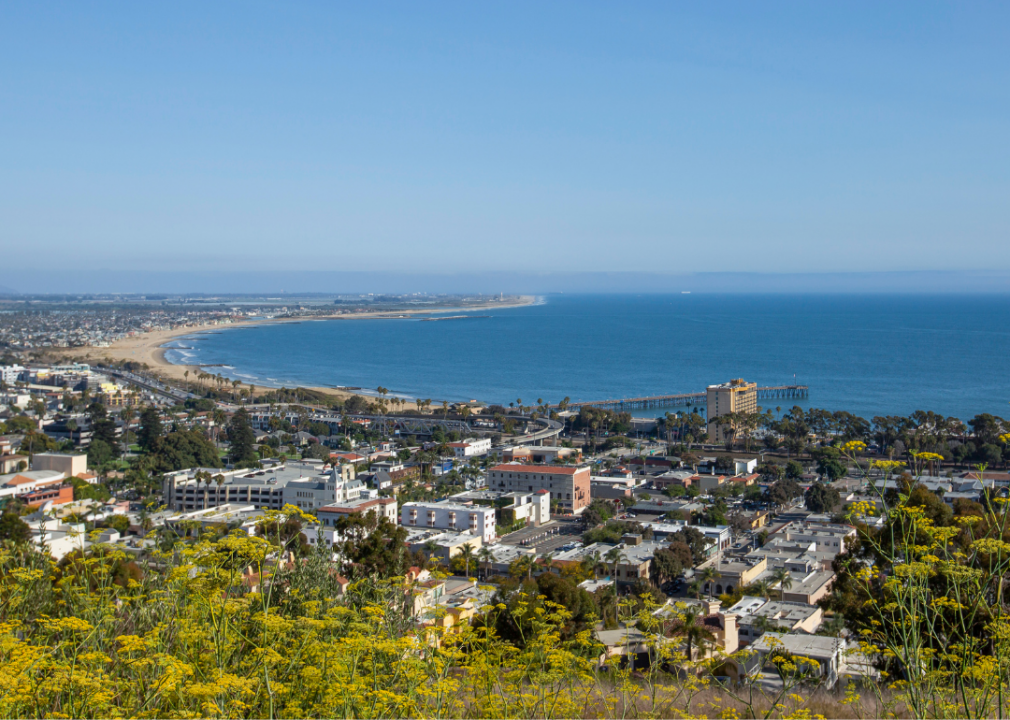
#44. Ventura County
– Child food insecurity rate: 12.8% (24,760 total)
— 3.3% lower than national average
– Food insecurity rate: 8.5% (72,180 total)
— 3.3% lower than national average
– Annual food budget shortfall: $43,297,000
— Cost per meal: $3.73
Aaronbrick // Wikicommons
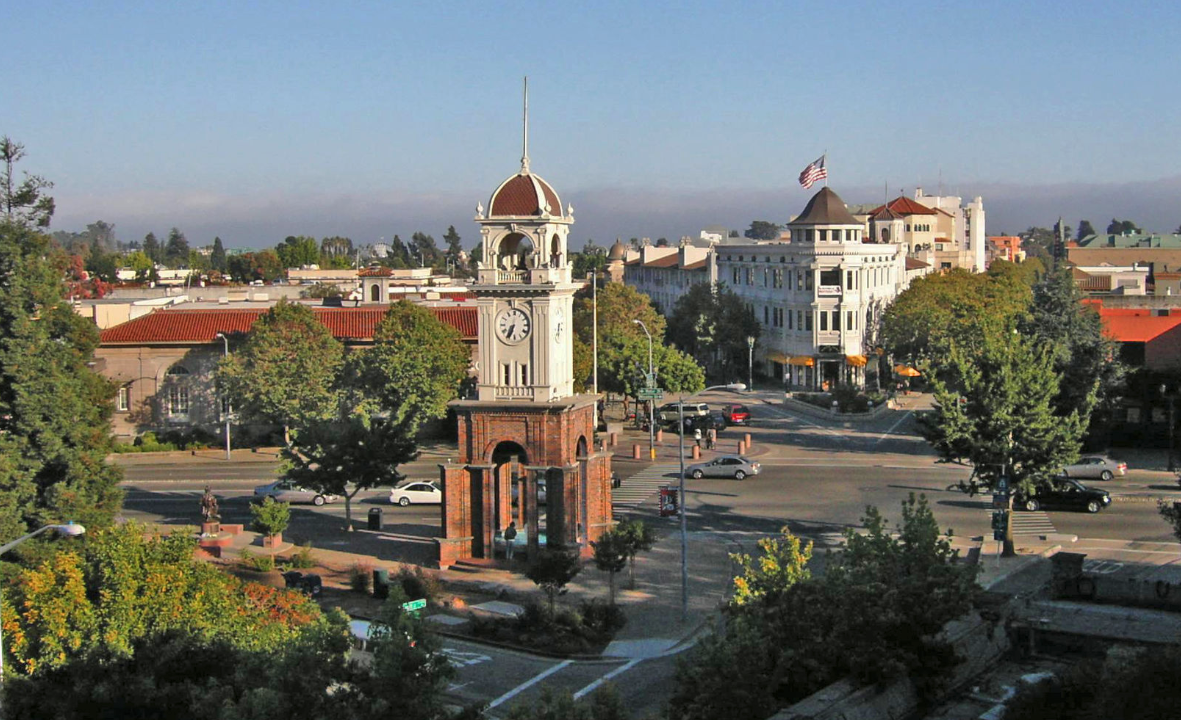
#43. Santa Cruz County
– Child food insecurity rate: 13.6% (7,090 total)
— 2.5% lower than national average
– Food insecurity rate: 10.0% (27,360 total)
— 1.8% lower than national average
– Annual food budget shortfall: $19,869,000
— Cost per meal: $4.51

Canva
#42. Sierra County
– Child food insecurity rate: 13.6% (60 total)
— 2.5% lower than national average
– Food insecurity rate: 11.3% (330 total)
— 0.5% lower than national average
– Annual food budget shortfall: $264,000
— Cost per meal: $4.96

Chuck Abbe // Wikimedia Commons
#41. Inyo County
– Child food insecurity rate: 13.7% (510 total)
— 2.4% lower than national average
– Food insecurity rate: 10.7% (1,910 total)
— 1.1% lower than national average
– Annual food budget shortfall: $1,032,000
— Cost per meal: $3.36

SD Dirk // Flickr
#40. San Diego County
– Child food insecurity rate: 14.2% (102,300 total)
— 1.9% lower than national average
– Food insecurity rate: 10.1% (336,190 total)
— 1.7% lower than national average
– Annual food budget shortfall: $200,073,000
— Cost per meal: $3.70

Pixabay
#39. Santa Barbara County
– Child food insecurity rate: 14.3% (14,170 total)
— 1.8% lower than national average
– Food insecurity rate: 9.2% (41,140 total)
— 2.6% lower than national average
– Annual food budget shortfall: $23,774,000
— Cost per meal: $3.59
Bobak Ha’Eri // Wikimedia Commons
#38. Amador County
– Child food insecurity rate: 14.4% (860 total)
— 1.7% lower than national average
– Food insecurity rate: 10.6% (4,160 total)
— 1.2% lower than national average
– Annual food budget shortfall: $2,825,000
— Cost per meal: $4.22
Michael Patrick // Wikimedia Commons
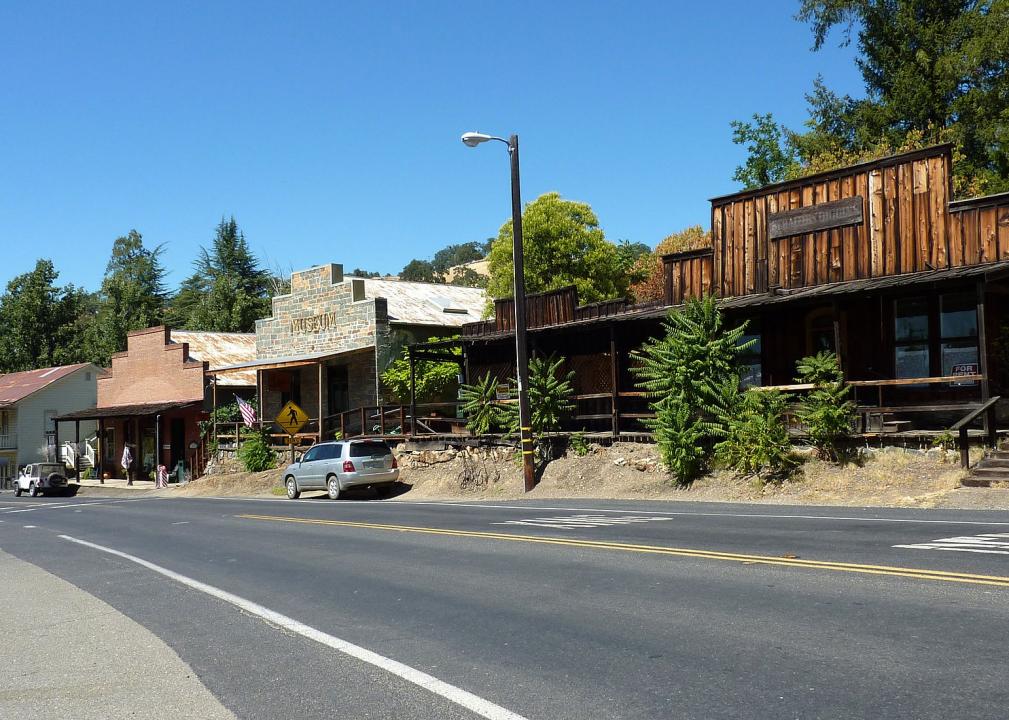
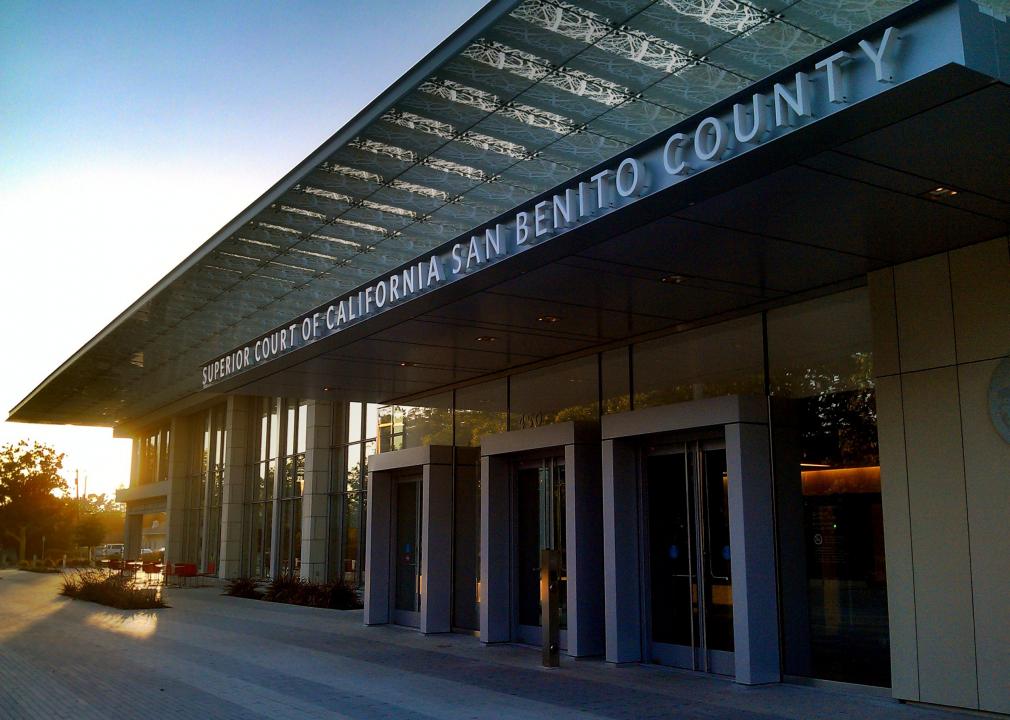
#37. San Benito County
– Child food insecurity rate: 14.5% (2,300 total)
— 1.6% lower than national average
– Food insecurity rate: 8.3% (5,100 total)
— 3.5% lower than national average
– Annual food budget shortfall: $3,677,000
— Cost per meal: $4.48

Susan Popielaski // Wikimedia Commons
#36. Alpine County
– Child food insecurity rate: 15.0% (40 total)
— 1.1% lower than national average
– Food insecurity rate: 11.7% (140 total)
— 0.1% lower than national average
– Annual food budget shortfall: $83,000
— Cost per meal: $3.68

Finetooth // Wikimedia Commons
#35. Lassen County
– Child food insecurity rate: 15.7% (780 total)
— 0.4% lower than national average
– Food insecurity rate: 11.2% (3,430 total)
— 0.6% lower than national average
– Annual food budget shortfall: $2,096,000
— Cost per meal: $3.80

Kenneth Green // Wikimedia Commons
#34. Plumas County
– Child food insecurity rate: 15.7% (500 total)
— 0.4% lower than national average
– Food insecurity rate: 13.1% (2,470 total)
— 1.3% higher than national average
– Annual food budget shortfall: $1,510,000
— Cost per meal: $3.80

Canva
#33. Solano County
– Child food insecurity rate: 16.0% (15,810 total)
— 0.1% lower than national average
– Food insecurity rate: 9.4% (41,840 total)
— 2.4% lower than national average
– Annual food budget shortfall: $23,888,000
— Cost per meal: $3.55

Daniel Orth // Flickr
#32. Riverside County
– Child food insecurity rate: 16.3% (99,900 total)
— 0.2% higher than national average
– Food insecurity rate: 9.7% (237,110 total)
— 2.1% lower than national average
– Annual food budget shortfall: $130,098,000
— Cost per meal: $3.41

Canva
#31. Calaveras County
– Child food insecurity rate: 16.4% (1,250 total)
— 0.3% higher than national average
– Food insecurity rate: 11.4% (5,240 total)
— 0.4% lower than national average
– Annual food budget shortfall: $3,779,000
— Cost per meal: $4.48

Bobak Ha’Eri // Wikimedia Commons
#30. Tuolumne County
– Child food insecurity rate: 16.4% (1,470 total)
— 0.3% higher than national average
– Food insecurity rate: 13.0% (7,050 total)
— 1.2% higher than national average
– Annual food budget shortfall: $4,568,000
— Cost per meal: $4.02

clr_flickr from Rocklin, USA // Wikimedia Commons
#29. Mono County
– Child food insecurity rate: 16.7% (500 total)
— 0.6% higher than national average
– Food insecurity rate: 10.7% (1,540 total)
— 1.1% lower than national average
– Annual food budget shortfall: $998,000
— Cost per meal: $4.02
Trance addict // Wikimedia Commons
#28. Glenn County
– Child food insecurity rate: 17.1% (1,280 total)
— 1.0% higher than national average
– Food insecurity rate: 12.5% (3,520 total)
— 0.7% higher than national average
– Annual food budget shortfall: $1,840,000
— Cost per meal: $3.25

Canva
#27. Sacramento County
– Child food insecurity rate: 17.3% (63,100 total)
— 1.2% higher than national average
– Food insecurity rate: 11.7% (179,280 total)
— 0.1% lower than national average
– Annual food budget shortfall: $102,961,000
— Cost per meal: $3.57

Cory Maylett // Wikimedia Commons
#26. Humboldt County
– Child food insecurity rate: 17.5% (4,550 total)
— 1.4% higher than national average
– Food insecurity rate: 15.0% (20,400 total)
— 3.2% higher than national average
– Annual food budget shortfall: $12,859,000
— Cost per meal: $3.92

Calilover // Wikimedia Commons
#25. Monterey County
– Child food insecurity rate: 17.7% (20,030 total)
— 1.6% higher than national average
– Food insecurity rate: 10.2% (44,380 total)
— 1.6% lower than national average
– Annual food budget shortfall: $26,411,000
— Cost per meal: $3.70

Canva
#24. Butte County
– Child food insecurity rate: 17.9% (8,050 total)
— 1.8% higher than national average
– Food insecurity rate: 14.0% (31,330 total)
— 2.2% higher than national average
– Annual food budget shortfall: $18,980,000
— Cost per meal: $3.76

Doug Kerr // Wikicommons
#23. Shasta County
– Child food insecurity rate: 17.9% (6,910 total)
— 1.8% higher than national average
– Food insecurity rate: 13.8% (24,670 total)
— 2.0% higher than national average
– Annual food budget shortfall: $14,144,000
— Cost per meal: $3.56

Scott Burley // Wikimedia Commons
#22. Modoc County
– Child food insecurity rate: 18.1% (310 total)
— 2.0% higher than national average
– Food insecurity rate: 13.6% (1,210 total)
— 1.8% higher than national average
– Annual food budget shortfall: $740,000
— Cost per meal: $3.80

Canva
#21. San Bernardino County
– Child food insecurity rate: 18.3% (104,370 total)
— 2.2% higher than national average
– Food insecurity rate: 10.6% (228,340 total)
— 1.2% lower than national average
– Annual food budget shortfall: $122,692,000
— Cost per meal: $3.34
Ray Bouknight // Wikicommons
#20. Sutter County
– Child food insecurity rate: 18.3% (4,580 total)
— 2.2% higher than national average
– Food insecurity rate: 12.5% (12,060 total)
— 0.7% higher than national average
– Annual food budget shortfall: $6,356,000
— Cost per meal: $3.27

U.S. Army Corps of Engineers Sacramento District // Wikimedia Commons
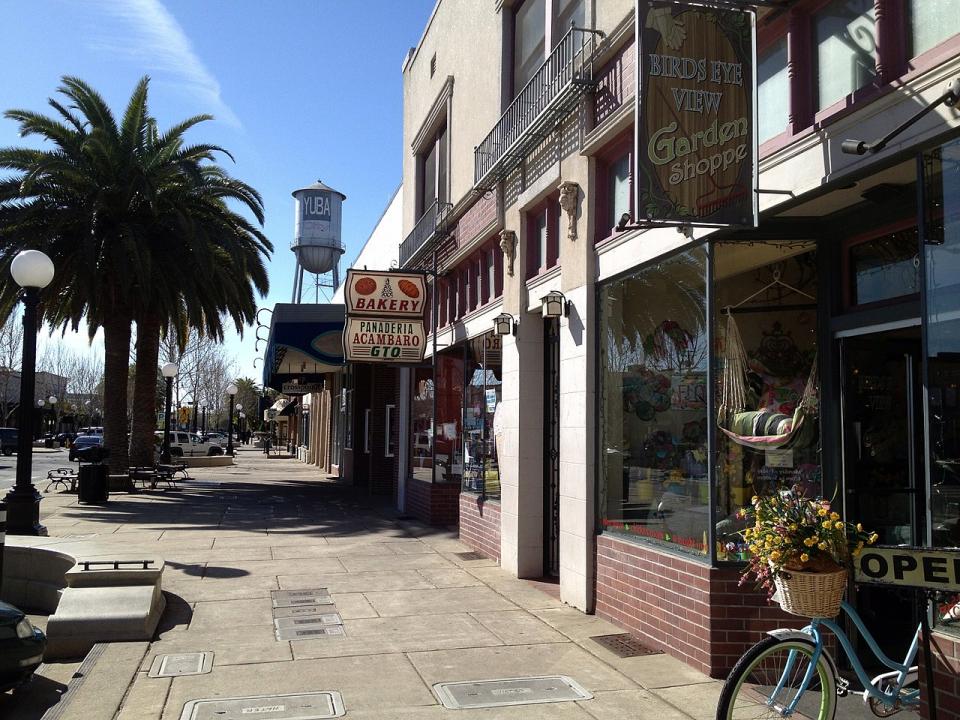
#19. Yuba County
– Child food insecurity rate: 18.3% (3,900 total)
— 2.2% higher than national average
– Food insecurity rate: 13.2% (10,260 total)
— 1.4% higher than national average
– Annual food budget shortfall: $5,298,000
— Cost per meal: $3.21

Public Domain
#18. Stanislaus County
– Child food insecurity rate: 18.5% (27,340 total)
— 2.4% higher than national average
– Food insecurity rate: 11.8% (64,320 total)
— 0.0% lower than national average
– Annual food budget shortfall: $37,385,000
— Cost per meal: $3.61

LPS.1 // Wikicommons
#17. San Joaquin County
– Child food insecurity rate: 19.3% (39,270 total)
— 3.2% higher than national average
– Food insecurity rate: 12.1% (90,820 total)
— 0.3% higher than national average
– Annual food budget shortfall: $51,570,000
— Cost per meal: $3.53

Chmee2 // Wikimedia Commons
#16. Siskiyou County
– Child food insecurity rate: 19.9% (1,750 total)
— 3.8% higher than national average
– Food insecurity rate: 15.0% (6,510 total)
— 3.2% higher than national average
– Annual food budget shortfall: $3,684,000
— Cost per meal: $3.51

Canva
#15. Del Norte County
– Child food insecurity rate: 20.0% (1,200 total)
— 3.9% higher than national average
– Food insecurity rate: 14.4% (3,990 total)
— 2.6% higher than national average
– Annual food budget shortfall: $2,174,000
— Cost per meal: $3.38

Binksternet // Wikimedia Commons
#14. Mendocino County
– Child food insecurity rate: 20.0% (3,710 total)
— 3.9% higher than national average
– Food insecurity rate: 13.9% (12,130 total)
— 2.1% higher than national average
– Annual food budget shortfall: $7,250,000
— Cost per meal: $3.71

BDS2006 // Wikimedia
#13. Los Angeles County
– Child food insecurity rate: 20.1% (438,950 total)
— 4.0% higher than national average
– Food insecurity rate: 12.7% (1,271,040 total)
— 0.9% higher than national average
– Annual food budget shortfall: $755,450,000
— Cost per meal: $3.69

Frank Schulenburg // Wikimedia Commons
#12. Tehama County
– Child food insecurity rate: 20.6% (3,160 total)
— 4.5% higher than national average
– Food insecurity rate: 14.5% (9,310 total)
— 2.7% higher than national average
– Annual food budget shortfall: $5,086,000
— Cost per meal: $3.39

Armona // Wikicommons
#11. Kings County
– Child food insecurity rate: 21.0% (8,610 total)
— 4.9% higher than national average
– Food insecurity rate: 12.6% (19,010 total)
— 0.8% higher than national average
– Annual food budget shortfall: $9,761,000
— Cost per meal: $3.19

Public Domain
#10. Madera County
– Child food insecurity rate: 21.5% (9,210 total)
— 5.4% higher than national average
– Food insecurity rate: 12.6% (19,680 total)
— 0.8% higher than national average
– Annual food budget shortfall: $12,674,000
— Cost per meal: $4.00
Almonroth // Wikimedia Commons
#9. Trinity County
– Child food insecurity rate: 21.8% (470 total)
— 5.7% higher than national average
– Food insecurity rate: 15.9% (2,000 total)
— 4.1% higher than national average
– Annual food budget shortfall: $1,147,000
— Cost per meal: $3.56
![]()
CFang // Wikimedia Commons
#8. Lake County
– Child food insecurity rate: 21.9% (2,960 total)
— 5.8% higher than national average
– Food insecurity rate: 15.0% (9,610 total)
— 3.2% higher than national average
– Annual food budget shortfall: $6,175,000
— Cost per meal: $3.99

CleanWater17 // Wikimedia Commons
#7. Colusa County
– Child food insecurity rate: 22.7% (1,330 total)
— 6.6% higher than national average
– Food insecurity rate: 12.9% (2,760 total)
— 1.1% higher than national average
– Annual food budget shortfall: $1,541,000
— Cost per meal: $3.47

nickchapman // Wikicommons
#6. Kern County
– Child food insecurity rate: 22.8% (58,950 total)
— 6.7% higher than national average
– Food insecurity rate: 14.3% (127,510 total)
— 2.5% higher than national average
– Annual food budget shortfall: $65,451,000
— Cost per meal: $3.19

EPoelzl // Wikimedia Commons
#5. Mariposa County
– Child food insecurity rate: 22.8% (650 total)
— 6.7% higher than national average
– Food insecurity rate: 14.9% (2,580 total)
— 3.1% higher than national average
– Annual food budget shortfall: $1,662,000
— Cost per meal: $4.00

David Jordan // Wikicommons
#4. Fresno County
– Child food insecurity rate: 23.0% (64,640 total)
— 6.9% higher than national average
– Food insecurity rate: 14.4% (142,780 total)
— 2.6% higher than national average
– Annual food budget shortfall: $76,283,000
— Cost per meal: $3.32

Mark Miller // Wikimedia Commons
#3. Merced County
– Child food insecurity rate: 23.0% (18,530 total)
— 6.9% higher than national average
– Food insecurity rate: 13.9% (38,150 total)
— 2.1% higher than national average
– Annual food budget shortfall: $21,049,000
— Cost per meal: $3.43

Canva
#2. Tulare County
– Child food insecurity rate: 24.1% (34,350 total)
— 8.0% higher than national average
– Food insecurity rate: 14.9% (69,330 total)
— 3.1% higher than national average
– Annual food budget shortfall: $37,453,000
— Cost per meal: $3.36

Rman 348 // Wikimedia Commons
#1. Imperial County
– Child food insecurity rate: 32.7% (16,930 total)
— 16.6% higher than national average
– Food insecurity rate: 19.0% (34,270 total)
— 7.2% higher than national average
– Annual food budget shortfall: $15,746,000
— Cost per meal: $2.85