Counties with the most motor vehicle accident fatalities in Arizona

United States Bureau of Land Management // Wikimedia Commons
Counties with the most motor vehicle accident fatalities in Arizona
Media outlets were quick during the onset of the COVID-19 pandemic and the consequent lockdowns that defined the summer and fall of 2020 to note just how little traffic there was as a result. Simple logic would suggest that less traffic equals a lower likelihood of accidents and thus fewer injuries and fatalities. Sadly, this was not the case.
Nationwide, traffic fatalities rose 7.2% in 2020 to nearly 39,000. That number was the highest recorded since 2007. Qualifying this disturbing fact is a sticky wicket—common denominators behind traffic deaths such as impaired driving, failure to use a seat belt, and excessive speed were certainly contributing factors, but they alone do not account for a rise in deaths commensurate with a 430-million-mile drop in the number of miles people traveled across the course of the year. What can be qualified, however, is where fatal crashes took place.
Citing data from the Fatality Analysis Reporting System, compiled by the National Highway Traffic Safety Administration, Stacker identified the counties in Arizona that had the most fatalities from motor vehicle crashes in 2020. The number of accident fatalities are ranked by the number of deaths per 100,000 people, with the raw number functioning as a tiebreaker. The analysis only looked at counties with at least five deaths during 2020. Additional data is included on pedestrian, bicyclist, and drunk-driving-related deaths. In counties where at least five fatalities happened on the same street or interstate, the road with the most deaths is also included.
![]()
Sean Pavone // Shutterstock
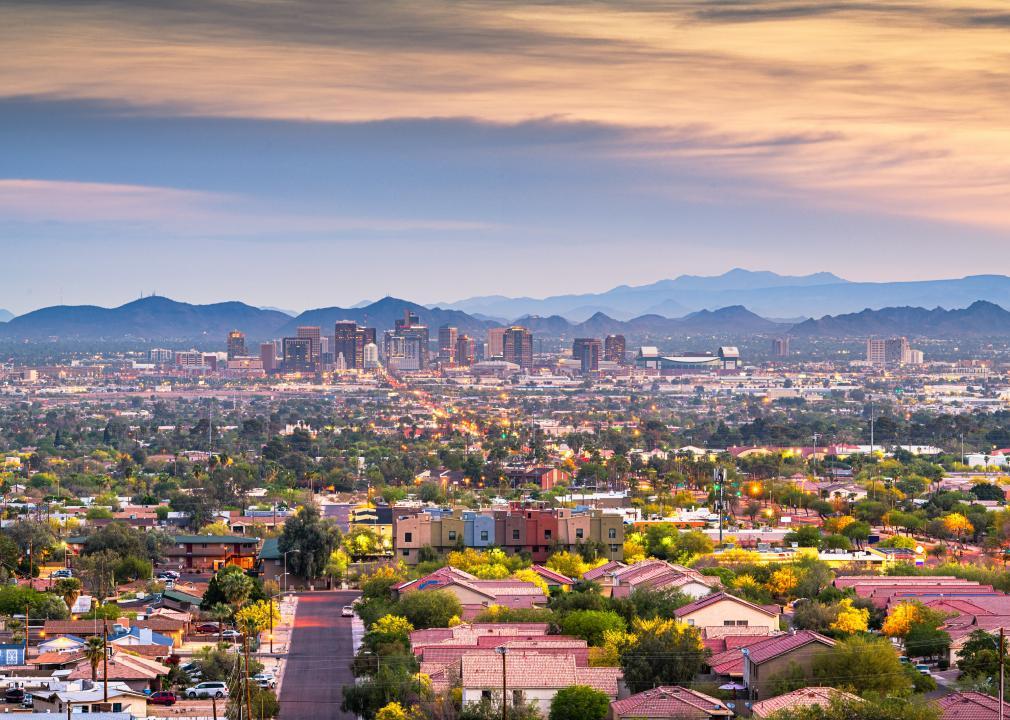
#13. Maricopa County, Arizona
– Motor vehicle crash fatalities: 11.3 per 100K people (#1,294 nationally, 495 deaths)
– 153 pedestrian deaths
– 17 bicyclist deaths
– 93 deaths involving drunk drivers
– Road with most fatalities: I-10 (22 fatalities)
zeesstof // Wikimedia Commons
#12. Pinal County, Arizona
– Motor vehicle crash fatalities: 12.8 per 100K people (#1,193 nationally, 54 deaths)
– 5 pedestrian deaths
– 2 bicyclist deaths
– 5 deaths involving drunk drivers
– Road with most fatalities: I-10 (9 fatalities)
Elnogalense // Wikimedia Commons
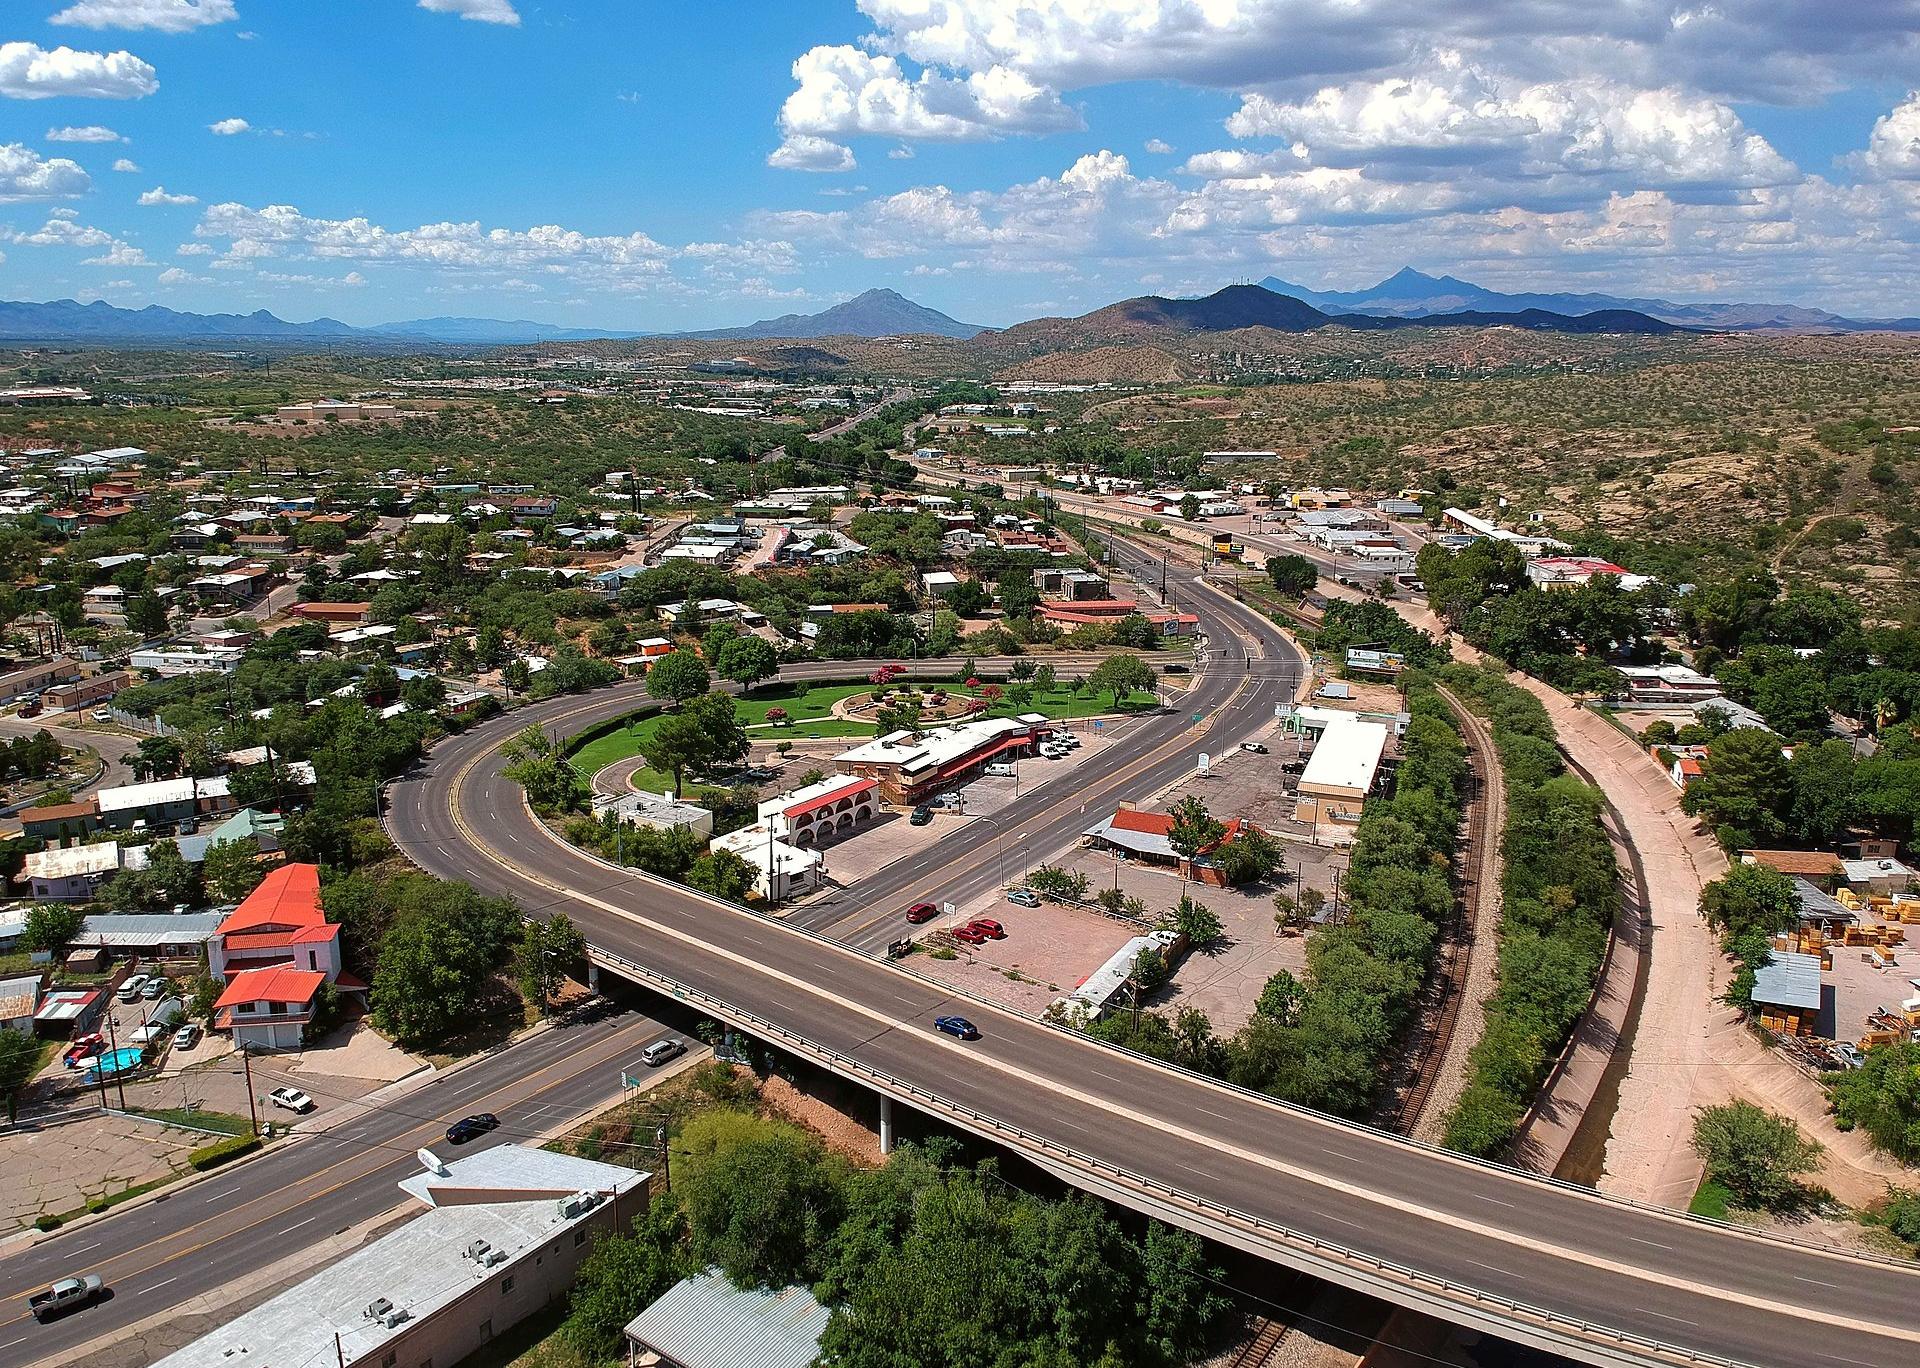
#11. Santa Cruz County, Arizona
– Motor vehicle crash fatalities: 14.7 per 100K people (#1,074 nationally, 7 deaths)
– 0 pedestrian deaths
– 1 bicyclist death
– 0 deaths involving drunk drivers
– Road with most fatalities: I-19 (5 fatalities)
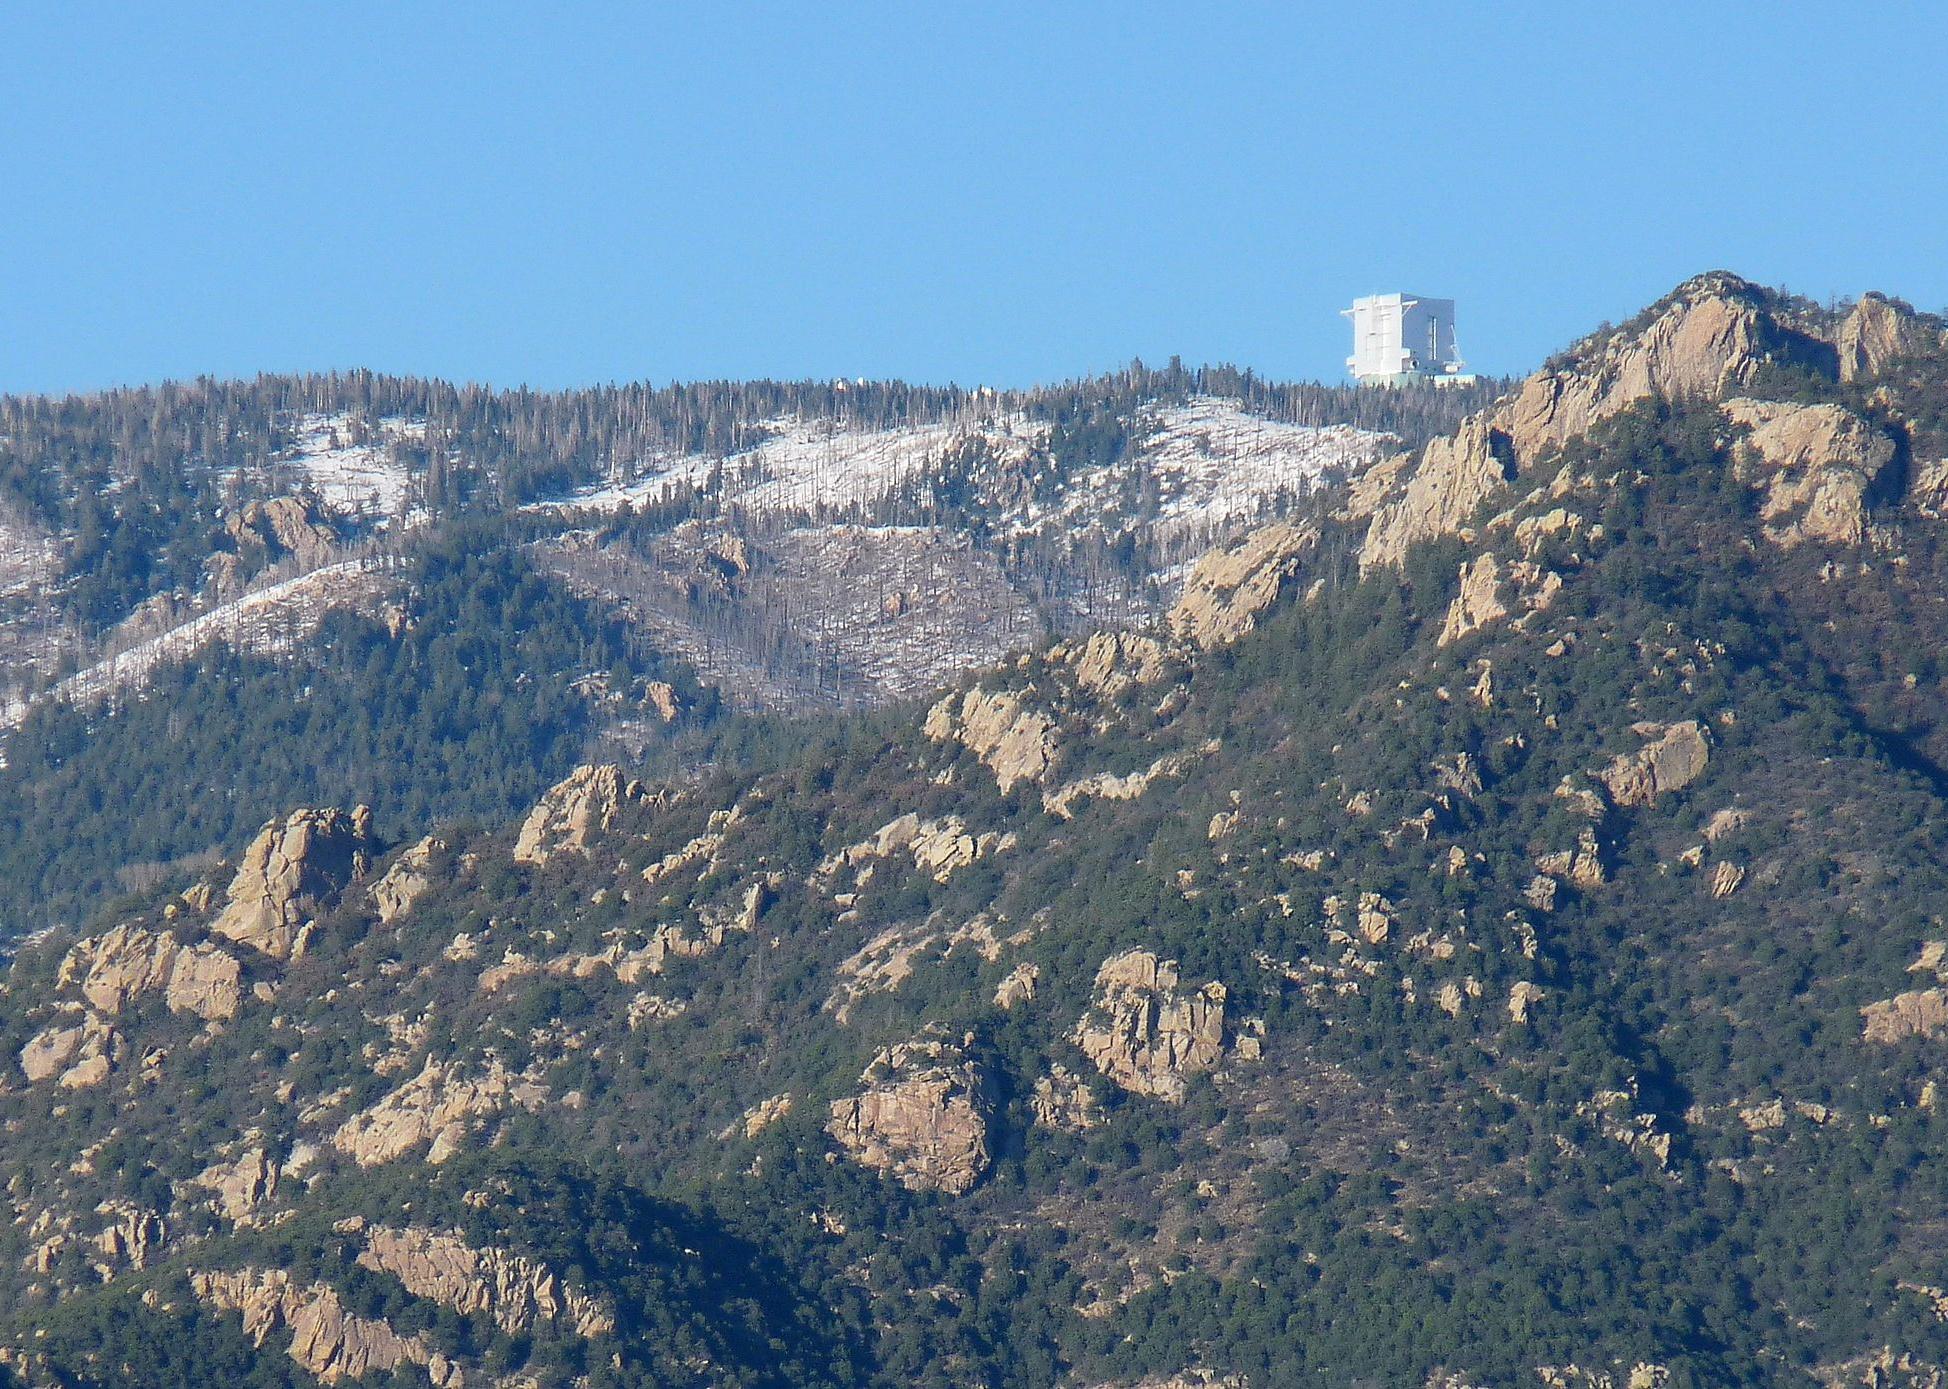
Jay Yuan // Shutterstock
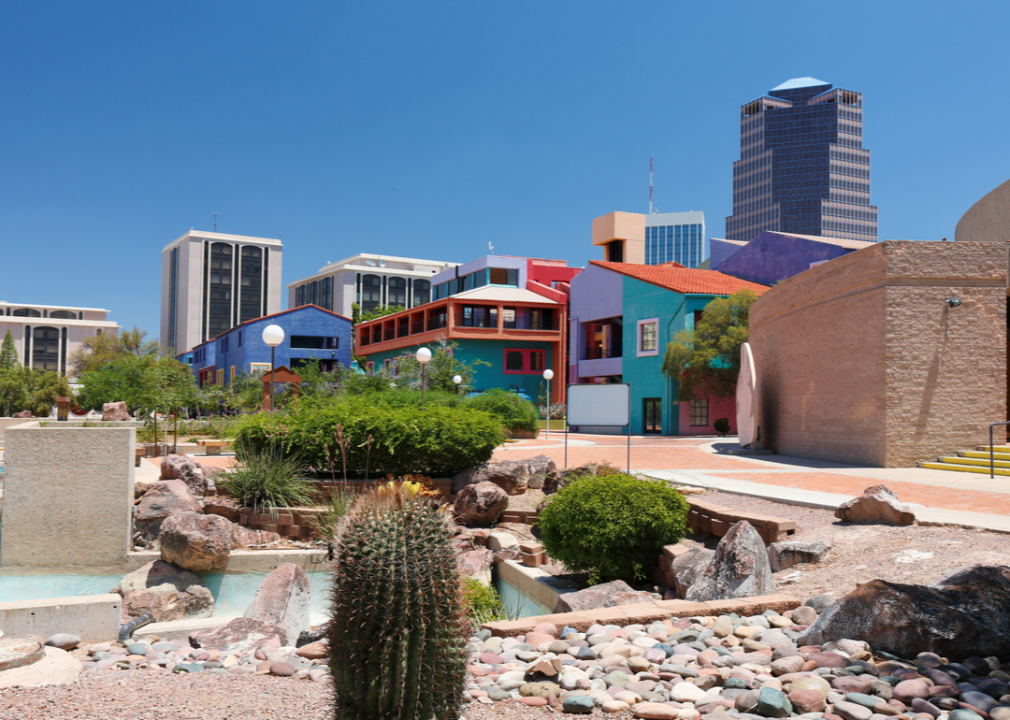
#10. Pima County, Arizona
– Motor vehicle crash fatalities: 15.9 per 100K people (#980 nationally, 165 deaths)
– 44 pedestrian deaths
– 8 bicyclist deaths
– 42 deaths involving drunk drivers
– Road with most fatalities: SR-86 (7 fatalities)
Clay Gilliland // Flickr
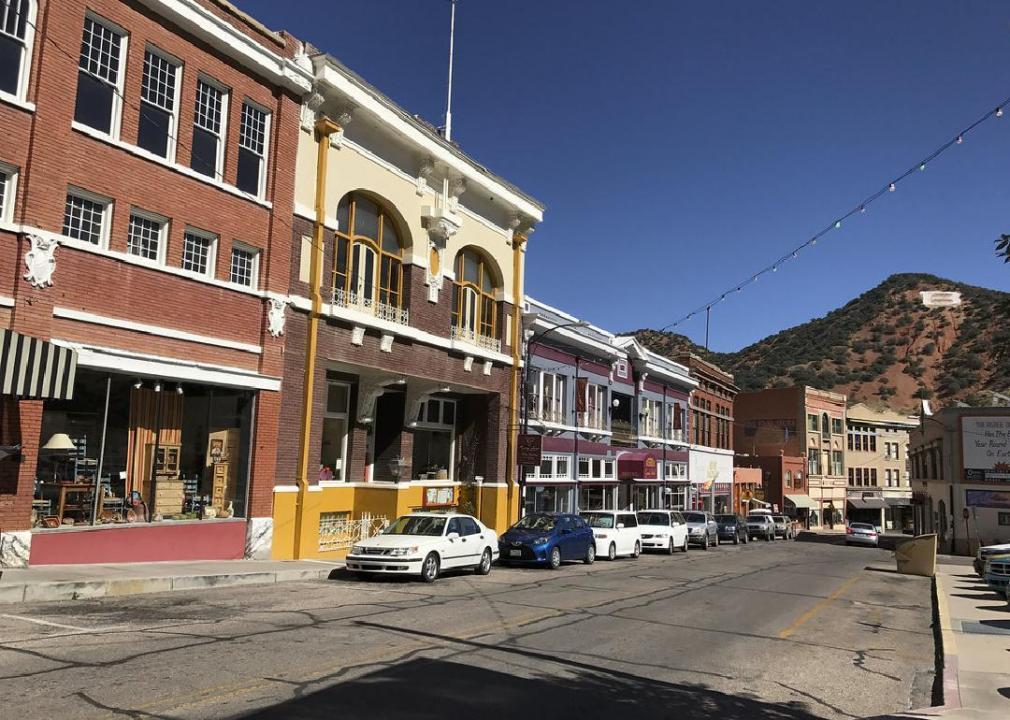
#9. Cochise County, Arizona
– Motor vehicle crash fatalities: 18.4 per 100K people (#839 nationally, 23 deaths)
– 2 pedestrian deaths
– 3 bicyclist deaths
– 3 deaths involving drunk drivers
– Road with most fatalities: I-10 (7 fatalities)
Africaspotter // Wikimedia Commons
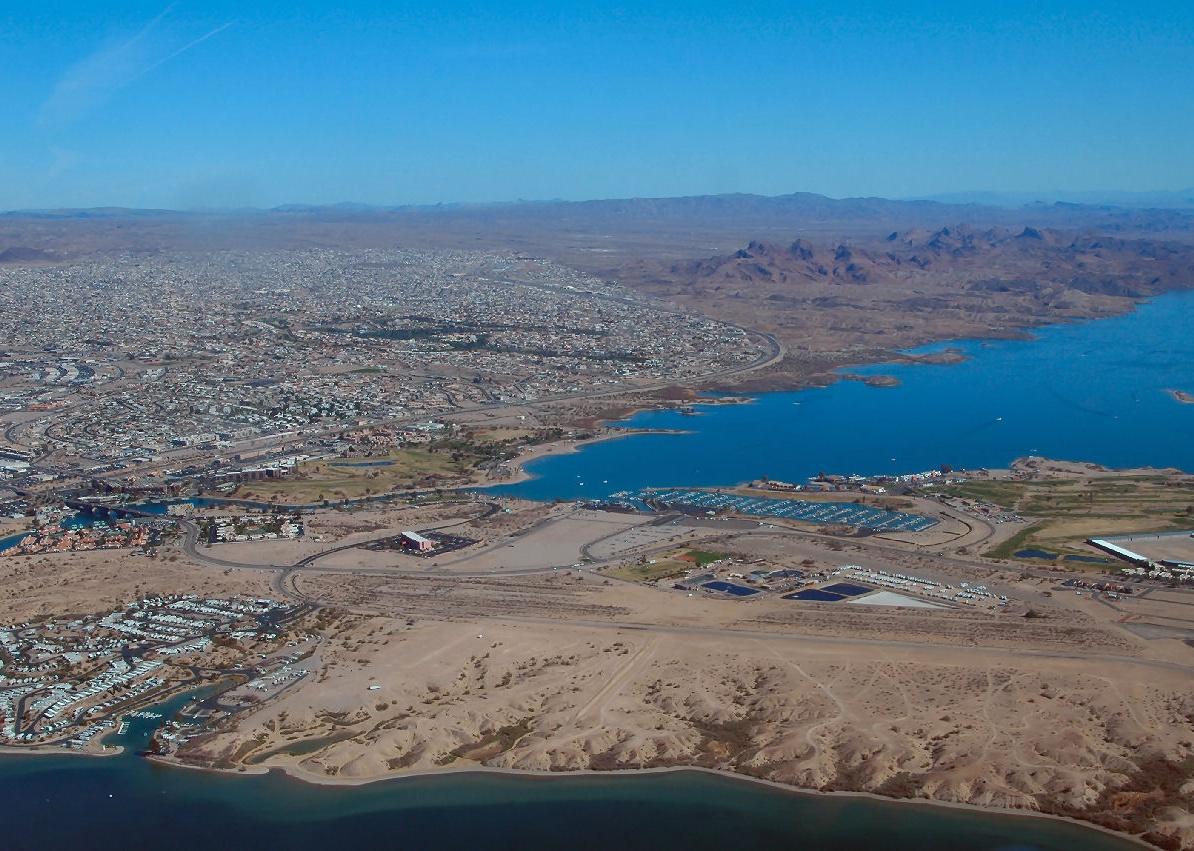
#8. Mohave County, Arizona
– Motor vehicle crash fatalities: 26.0 per 100K people (#541 nationally, 55 deaths)
– 4 pedestrian deaths
– 0 bicyclist deaths
– 8 deaths involving drunk drivers
– Road with most fatalities: SR-95 (12 fatalities)
Martha.baden // Wikimedia
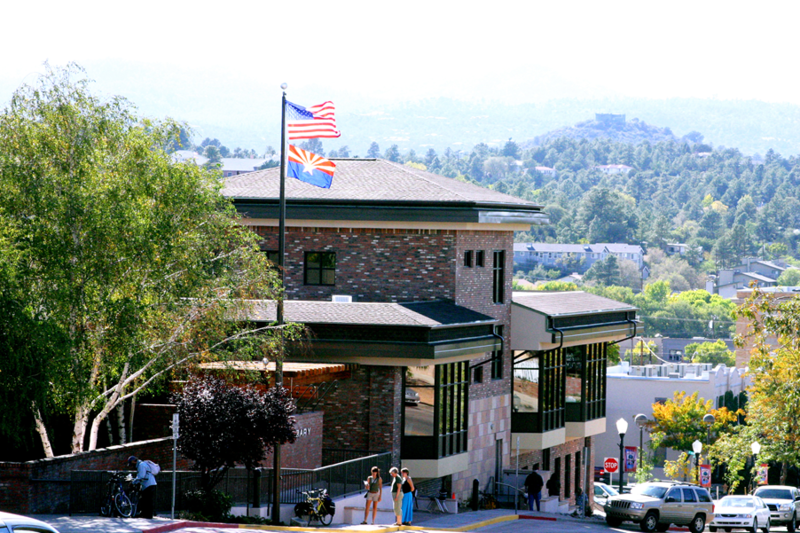
#7. Yavapai County, Arizona
– Motor vehicle crash fatalities: 26.9 per 100K people (#508 nationally, 63 deaths)
– 3 pedestrian deaths
– 1 bicyclist death
– 8 deaths involving drunk drivers
– Road with most fatalities: SR-89 (7 fatalities)
HildaWeges Photography // Shutterstock
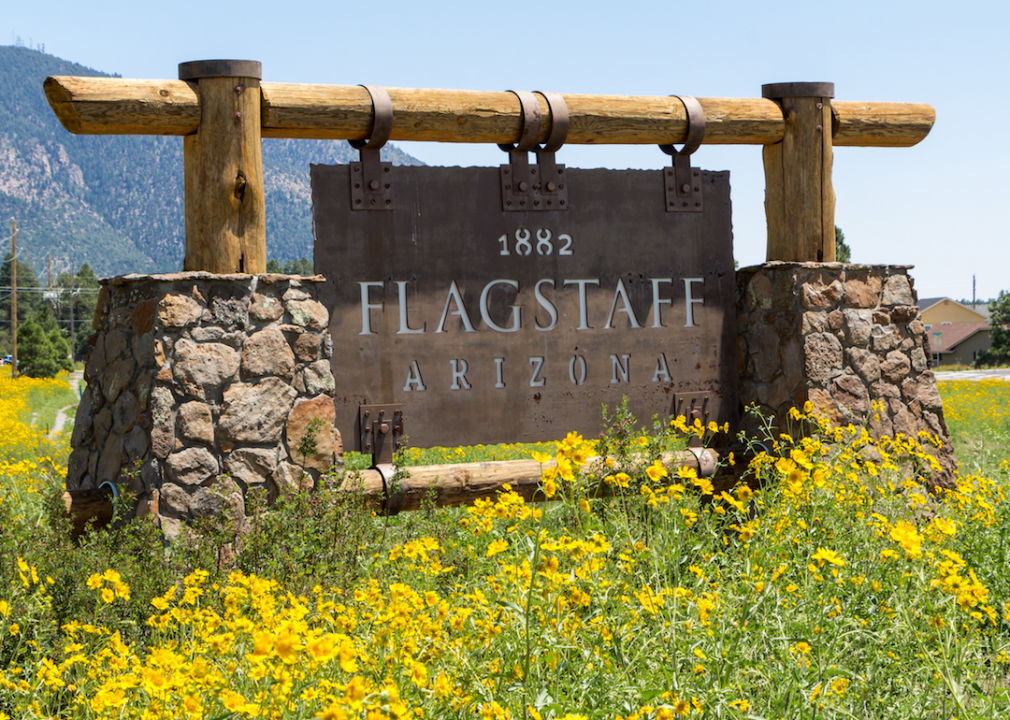
#6. Coconino County, Arizona
– Motor vehicle crash fatalities: 29.7 per 100K people (#419 nationally, 43 deaths)
– 8 pedestrian deaths
– 1 bicyclist death
– 7 deaths involving drunk drivers
– Road with most fatalities: US-89 (11 fatalities)

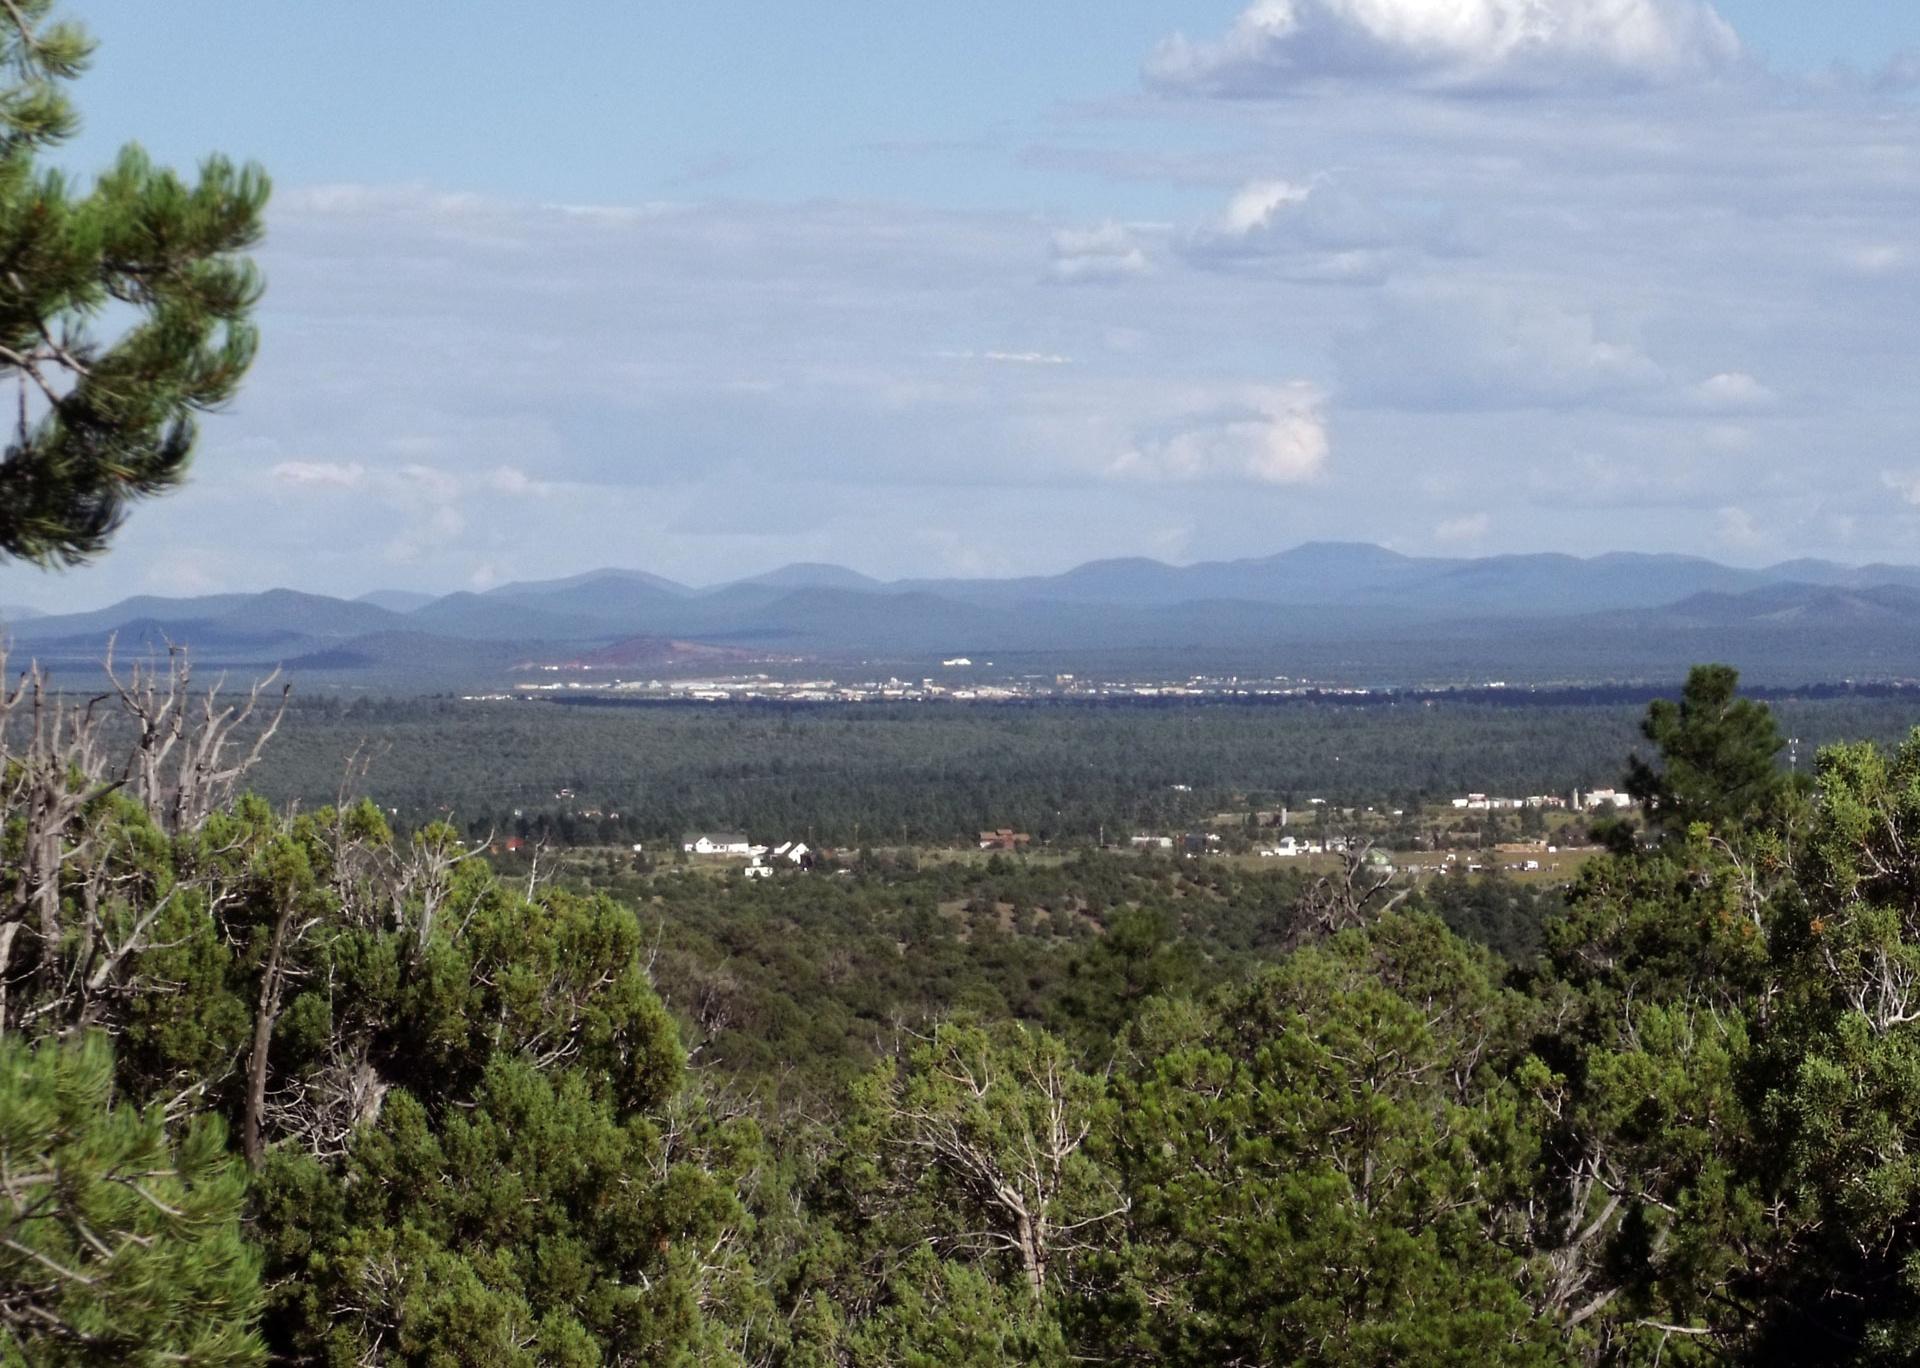
Andreas F. Borchert // Wikimedia Commons
#5. Apache County, Arizona
– Motor vehicle crash fatalities: 34.6 per 100K people (#321 nationally, 23 deaths)
– 3 pedestrian deaths
– 0 bicyclist deaths
– 2 deaths involving drunk drivers
– Road with most fatalities: I-40 (7 fatalities)
Ixnayonthetimmay // Wikimedia Commons
#4. Navajo County, Arizona
– Motor vehicle crash fatalities: 35.6 per 100K people (#295 nationally, 38 deaths)
– 4 pedestrian deaths
– 1 bicyclist death
– 6 deaths involving drunk drivers
– Road with most fatalities: I-40 (8 fatalities)
Wars // Wikimedia Commons
#3. Graham County, Arizona
– Motor vehicle crash fatalities: 36.7 per 100K people (#271 nationally, 14 deaths)
– 1 pedestrian death
– 0 bicyclist deaths
– 5 deaths involving drunk drivers
– Road with most fatalities: US-70 (11 fatalities)
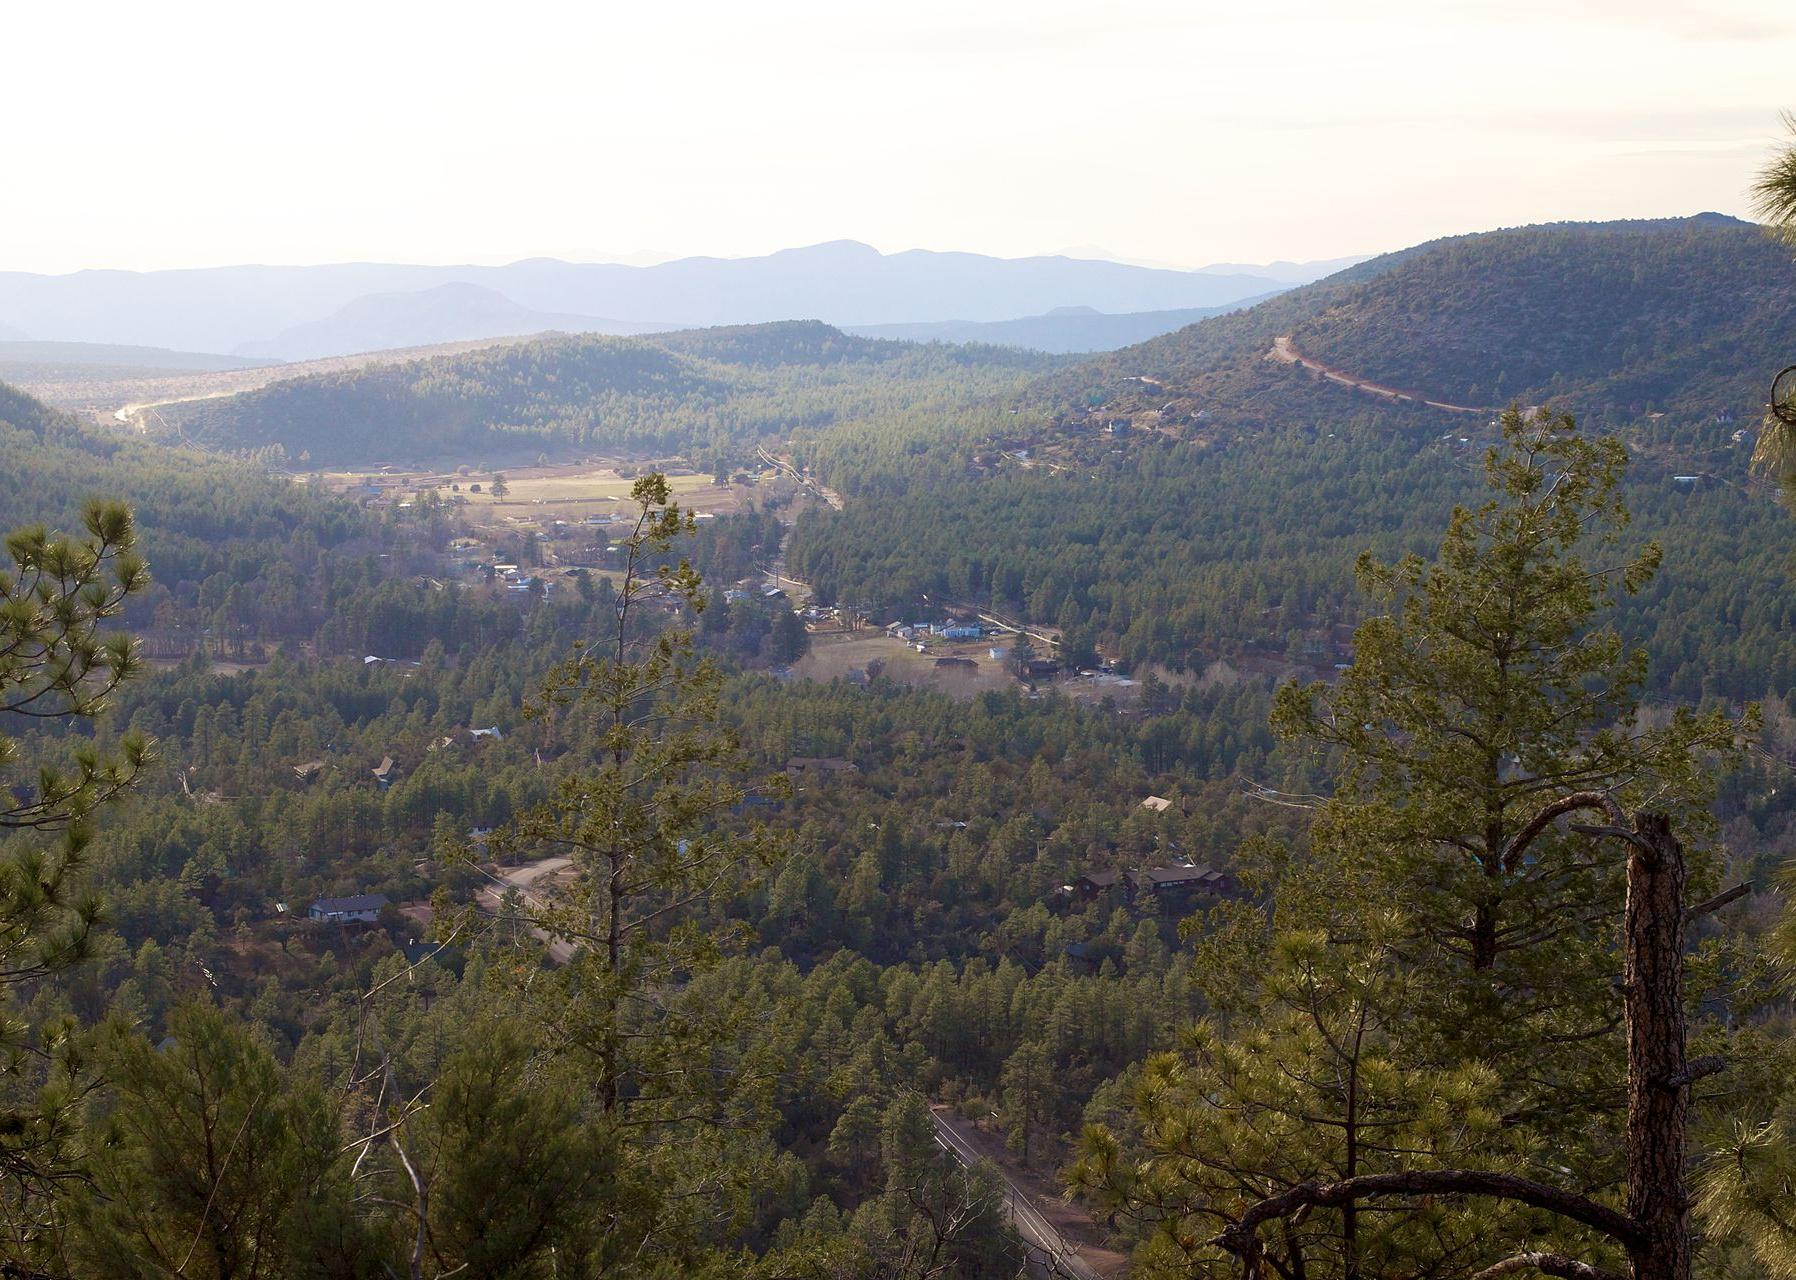
Alan Levine // Wikimedia Commons
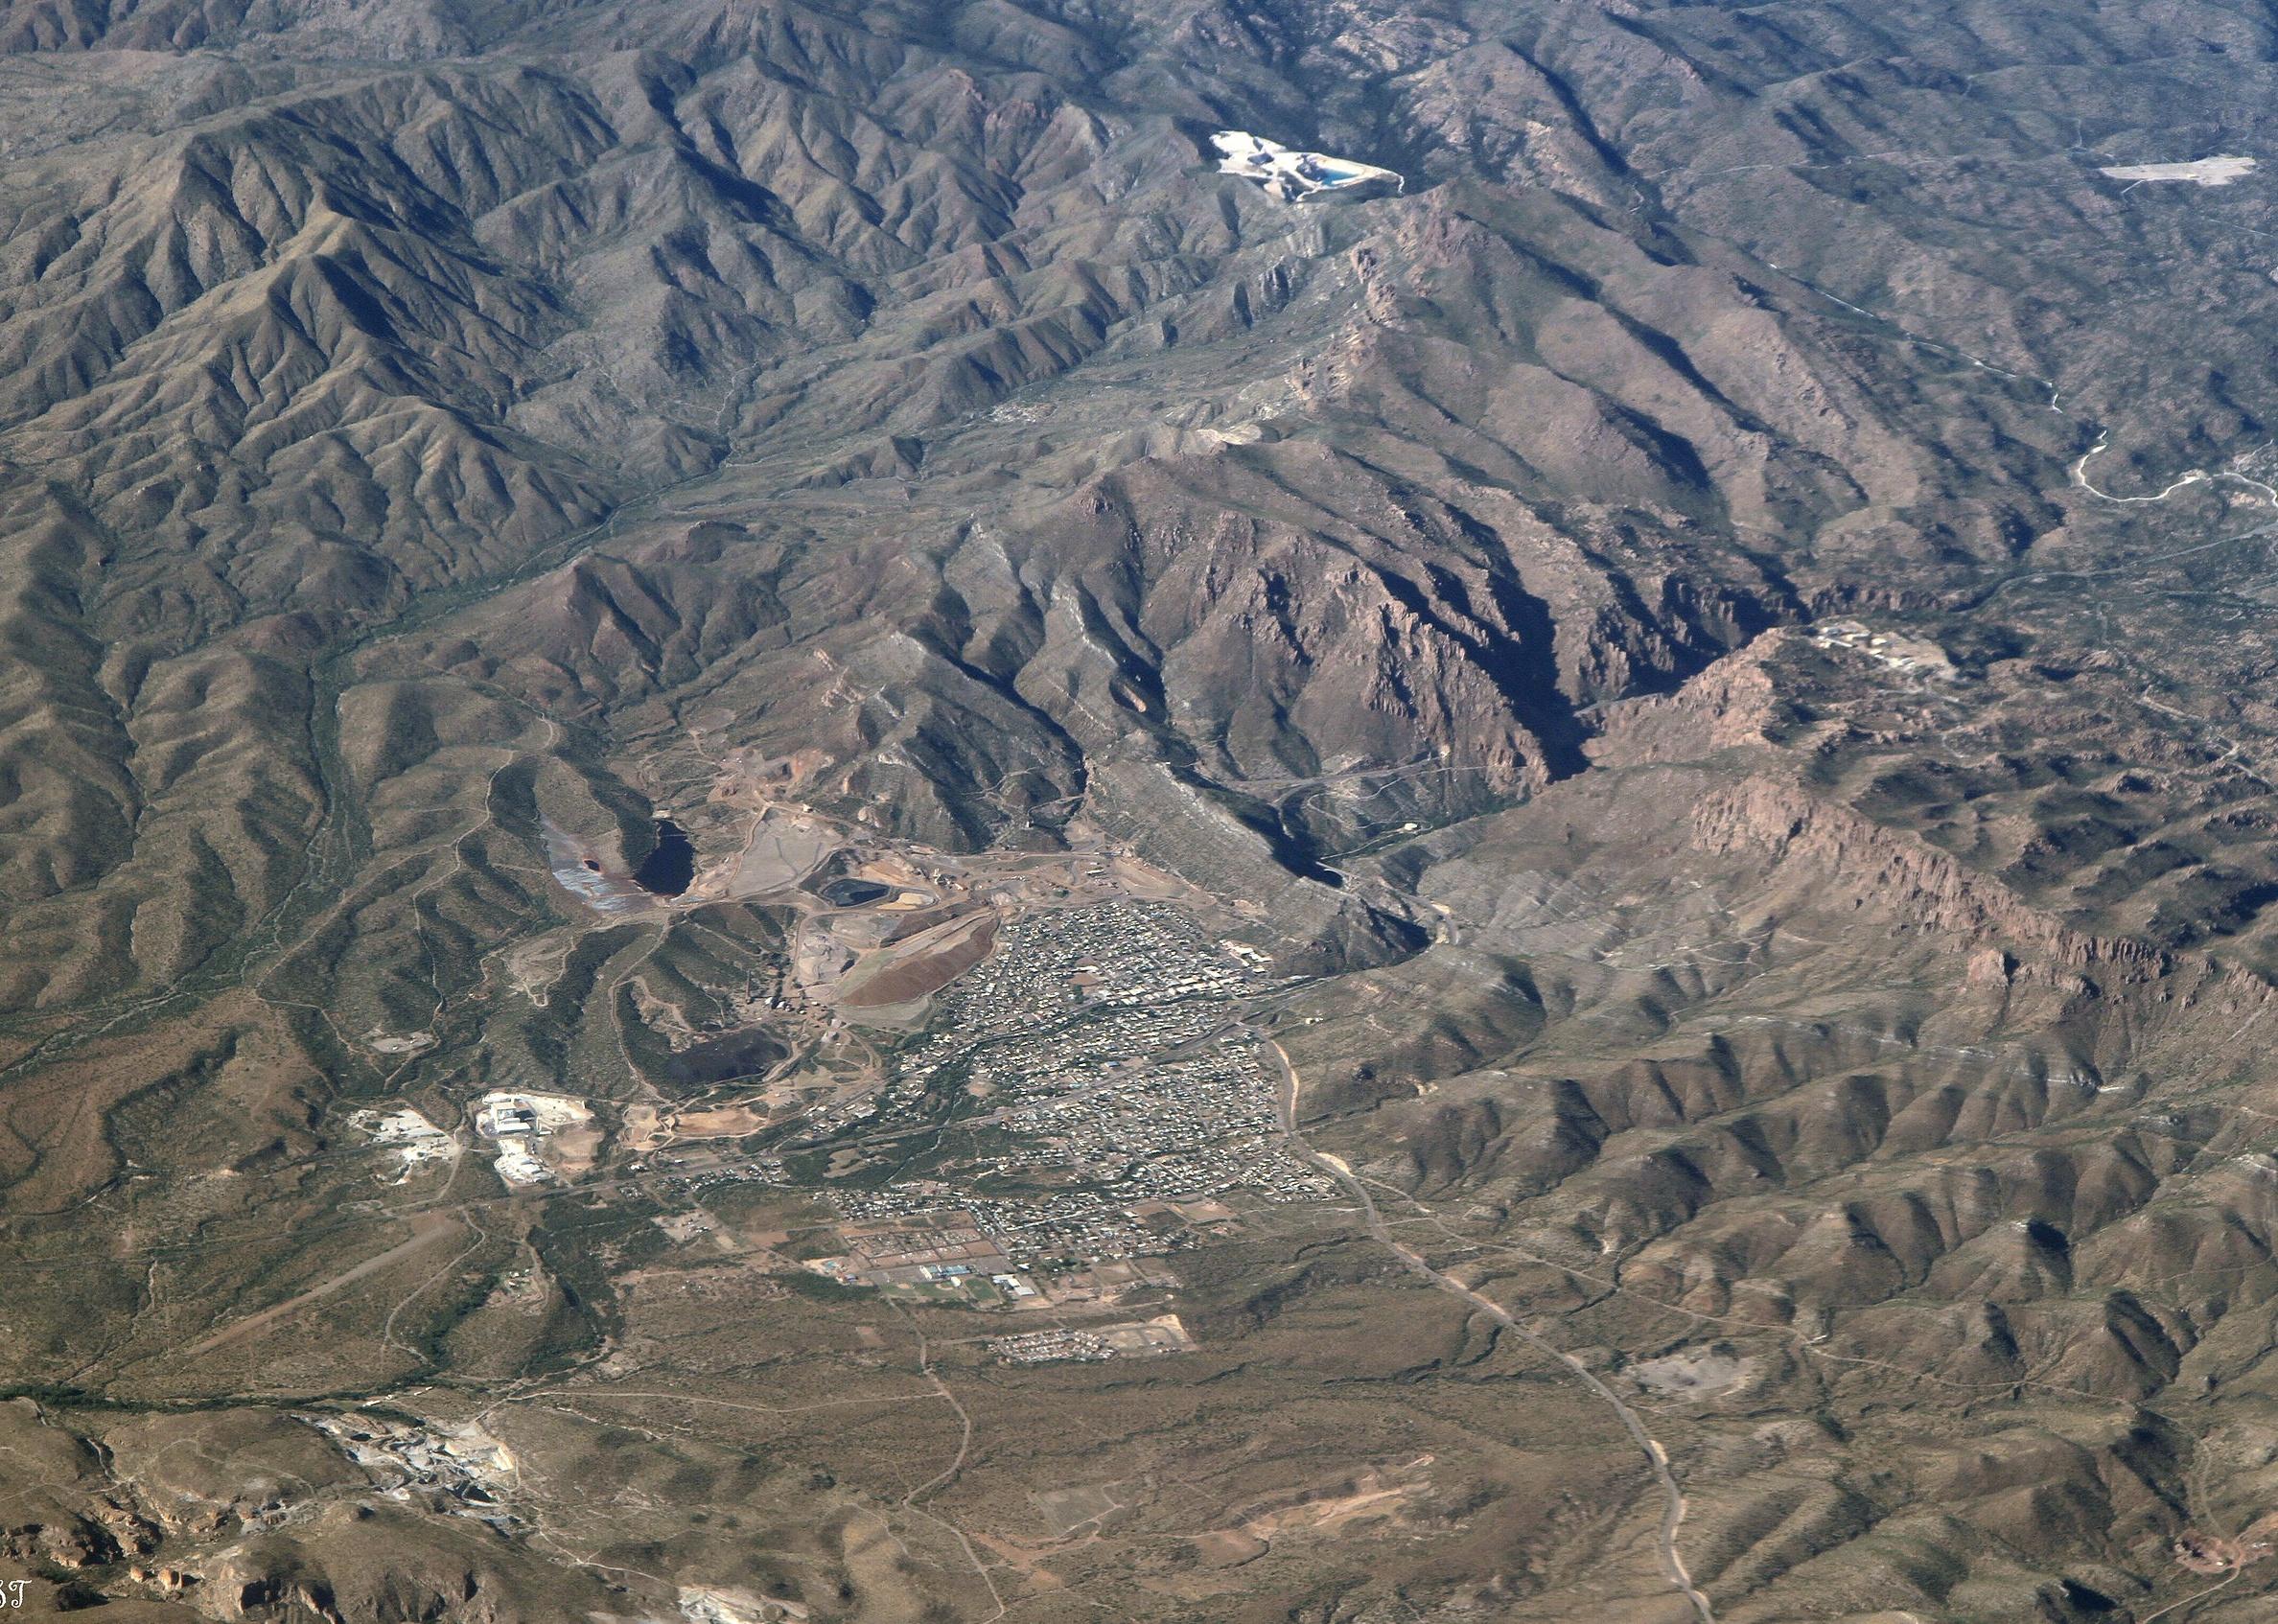
#2. Gila County, Arizona
– Motor vehicle crash fatalities: 45.1 per 100K people (#186 nationally, 24 deaths)
– 5 pedestrian deaths
– 1 bicyclist death
– 3 deaths involving drunk drivers
– Road with most fatalities: SR-87 (6 fatalities)
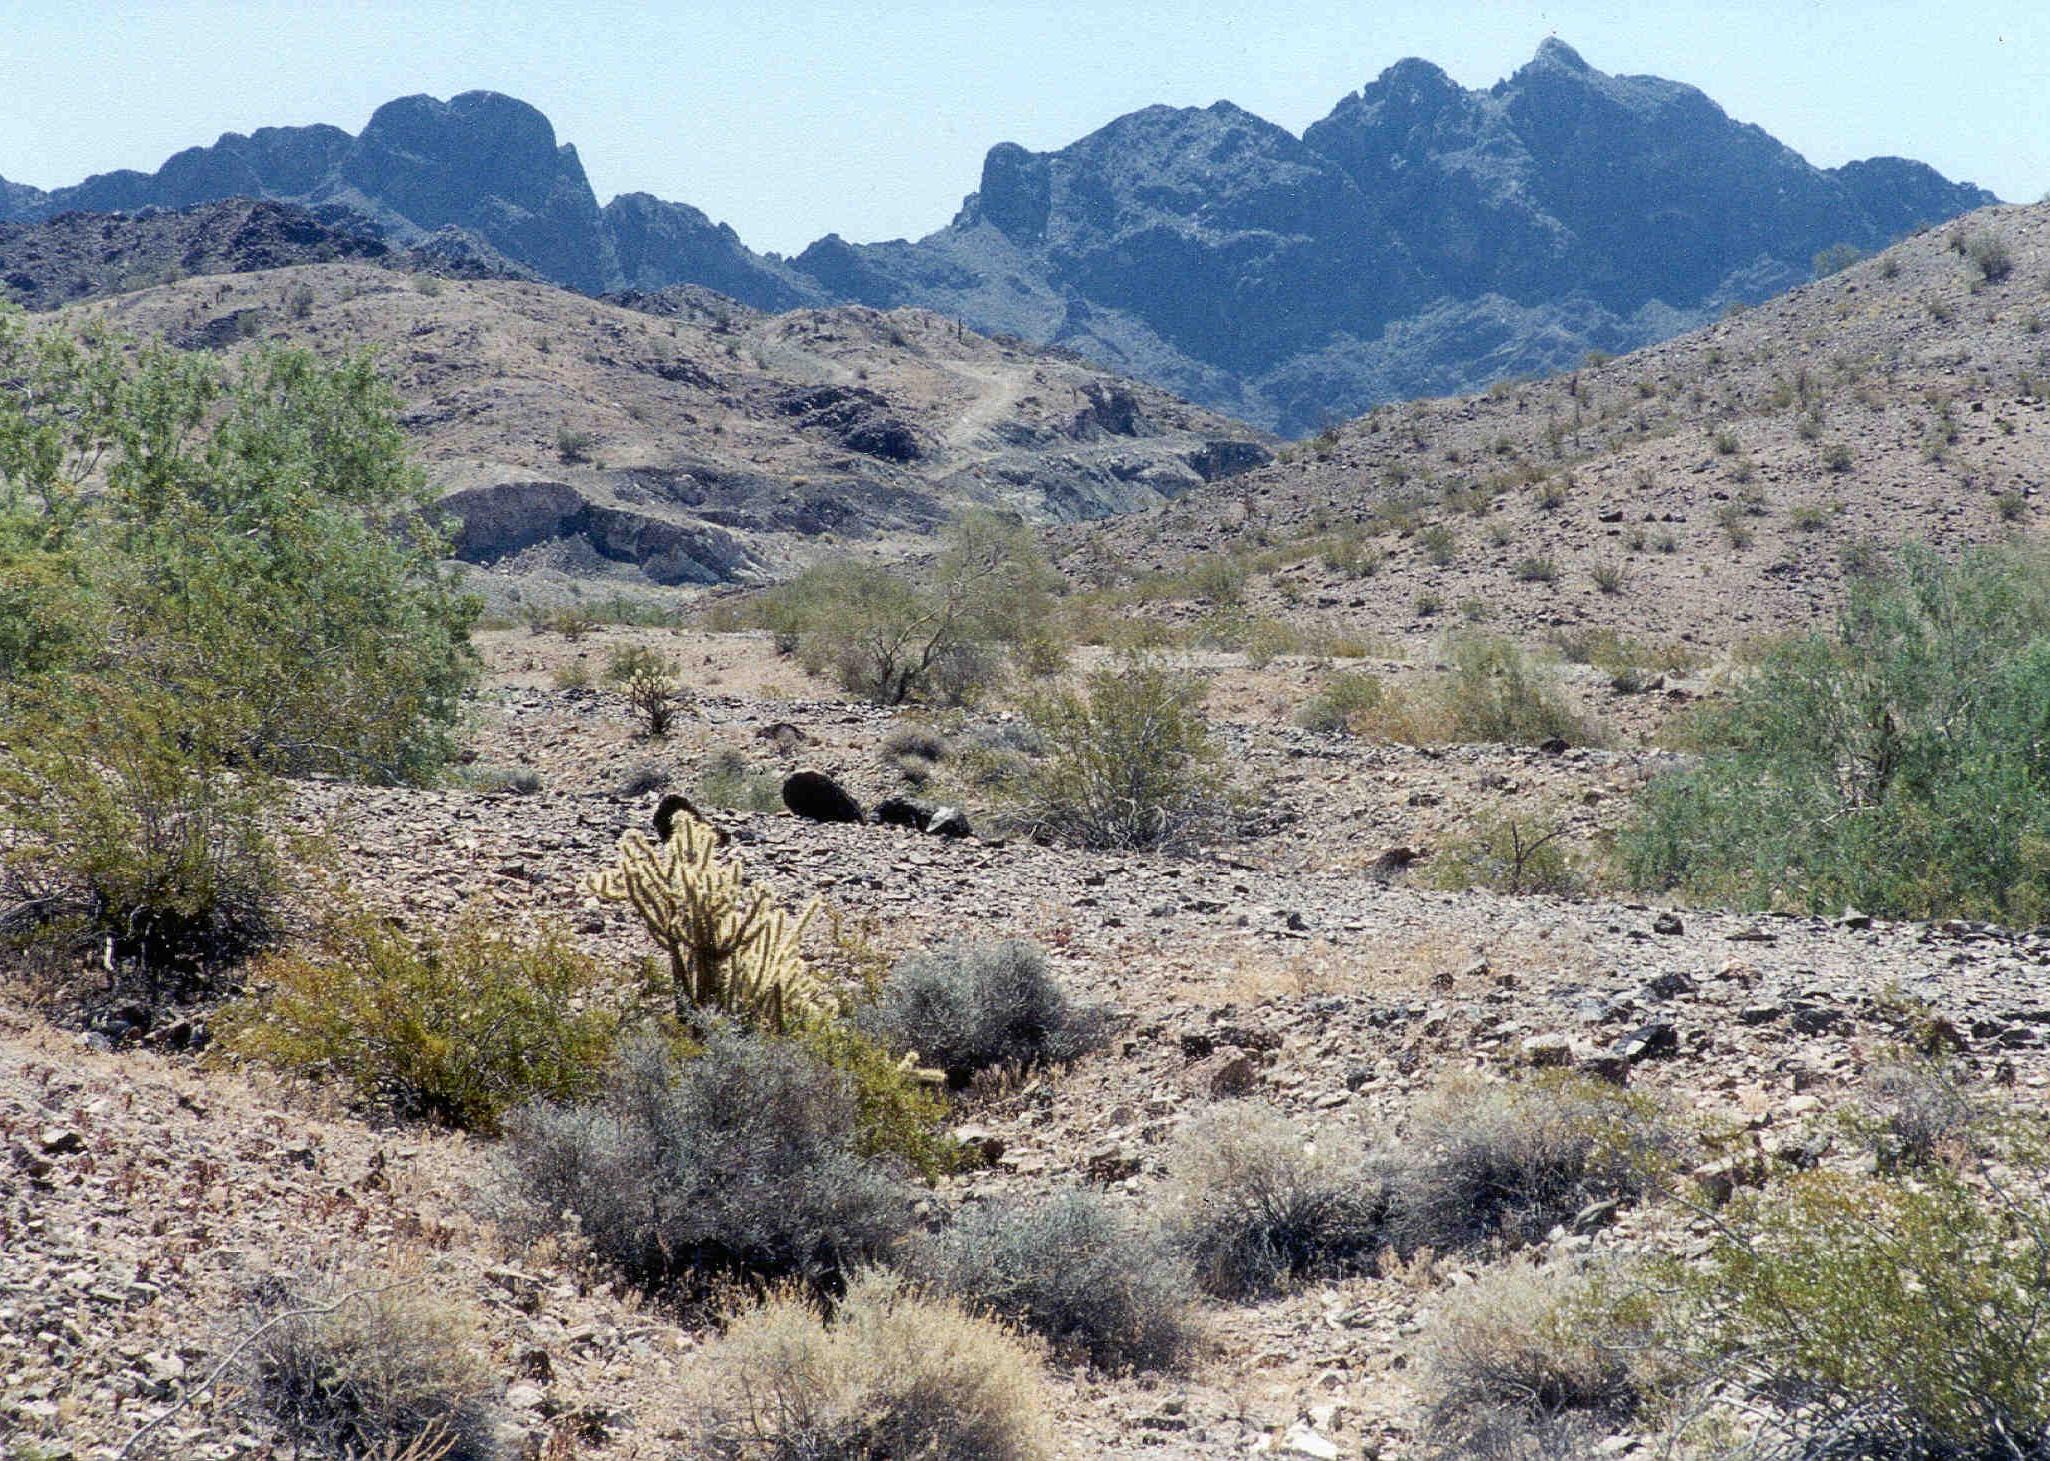
United States Bureau of Land Management // Wikimedia Commons
#1. La Paz County, Arizona
– Motor vehicle crash fatalities: 100.9 per 100K people (#26 nationally, 17 deaths)
– 1 pedestrian death
– 0 bicyclist deaths
– 4 deaths involving drunk drivers
– Road with most fatalities: I-10 (6 fatalities)