Counties with the most super commuters in Arizona
Alan Levine // Wikimedia Commons
Counties with the most super commuters in Arizona
There are more than 283 million vehicles on the road in the United States, and many of those cars, trucks, vans, and motorcycles are used to ferry people to and from their homes and jobs during their daily commutes. A small but growing number of people are walking and biking to work, particularly in compact college towns. Many more take public transportation, especially in major cities like New York, Chicago, San Francisco, Washington D.C., Boston, and Seattle—but nationwide, public transit accounts for only about 5% of daily commutes.
The overwhelming majority of people still drive to and from work every day, and the vast majority of those car commuters drive alone—fewer than 10% of Americans carpool. According to the U.S. Census Bureau, the average one-way commute in the United States has grown to a record 26.9 minutes. That’s just shy of an hour a day that average Americans squander behind the wheel, not at home with their families, and instead, burning gas and putting miles on their cars.
For some Americans, however, the commute to work is far from average. A phenomenon known as super commuting has emerged and grown in recent years. Super commuters spend 90 minutes or more—each way—chasing their paychecks every day. The biggest percentage of super commuters work in the extraction industry, with workers pursuing lucrative jobs in remote mines, oil fields, and other energy operations. Many more, however, have been priced out of expensive housing in urban metro areas where high-paying jobs are located, far away from their less-expensive county of residence.
Stacker compiled a list of counties with the most super commuters in Arizona using data from the U.S. Census Bureau. Counties are ranked by the highest percent of workers with a commute over 90 minutes, based on 2020 5-year estimates. Keep reading to see where in your state people are spending the most time going to and from work every day.
You may also like: Cities with the most expensive homes in Arizona
![]()
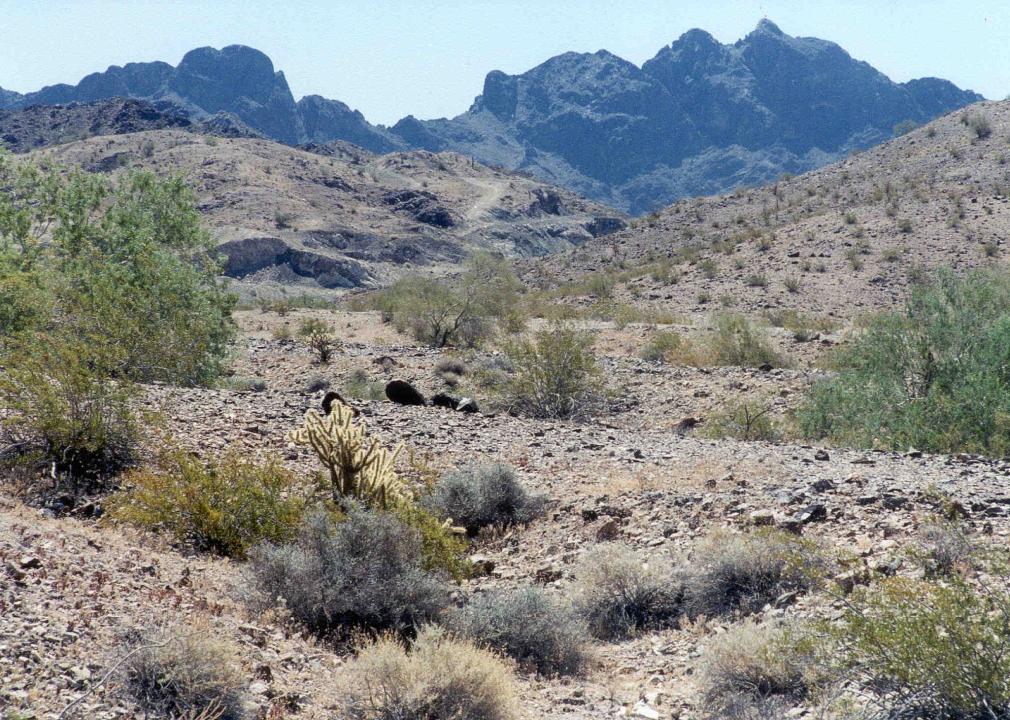
United States Bureau of Land Management // Wikimedia Commons
#15. La Paz County
– Workers with 90+ minute commute: 0.3%
— 60+ minute commute: 2.0%
– Average commute time: 14.4 minutes
— 11.4 minutes shorter than state average
– Left for work from 12 a.m. to 6 a.m.: 15.7%
– Worked outside county of residence: 2.8%
– Means of transportation: drove alone (81.0%), carpooled (11.0%), walked to work (3.1%), public transportation (0.0%), worked from home (2.4%)
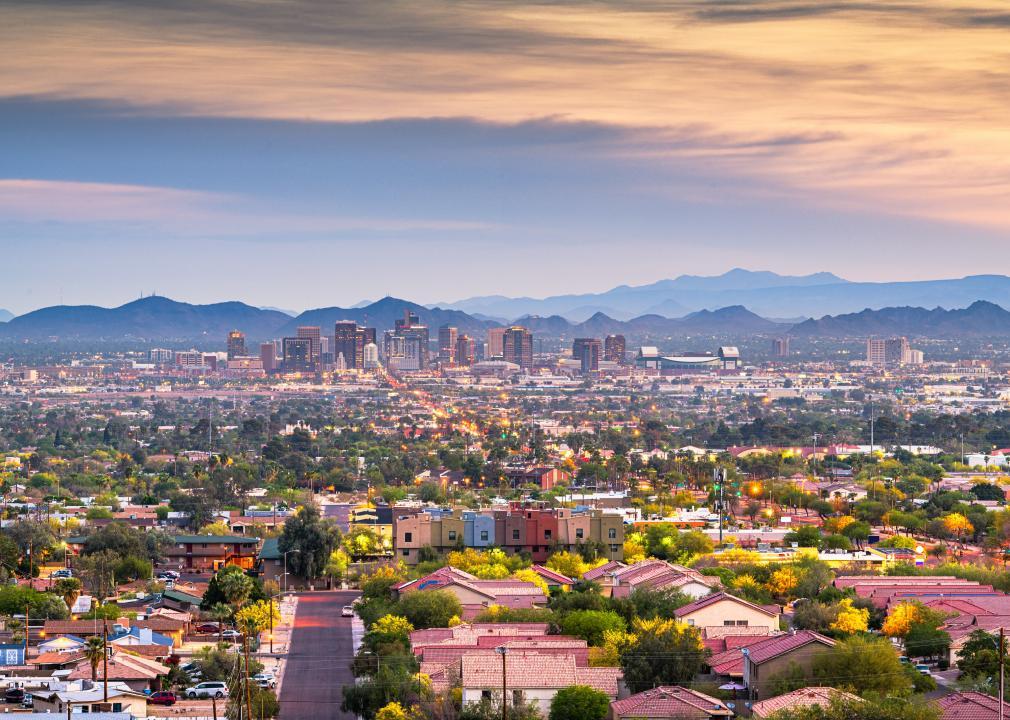
Sean Pavone // Shutterstock
#14. Maricopa County
– Workers with 90+ minute commute: 1.8%
— 60+ minute commute: 7.2%
– Average commute time: 26.5 minutes
— 0.7 minutes longer than state average
– Left for work from 12 a.m. to 6 a.m.: 19.6%
– Worked outside county of residence: 1.0%
– Means of transportation: drove alone (73.7%), carpooled (10.7%), walked to work (1.5%), public transportation (1.8%), worked from home (9.8%)
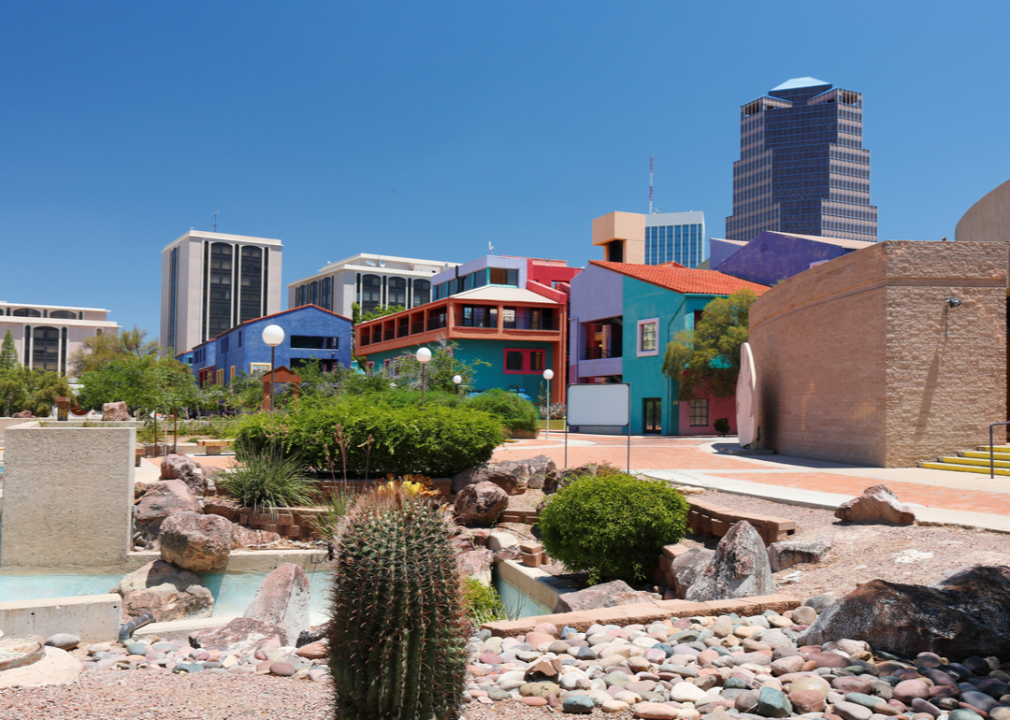
Jay Yuan // Shutterstock
#13. Pima County
– Workers with 90+ minute commute: 1.8%
— 60+ minute commute: 4.4%
– Average commute time: 24.7 minutes
— 1.1 minutes shorter than state average
– Left for work from 12 a.m. to 6 a.m.: 16.2%
– Worked outside county of residence: 2.0%
– Means of transportation: drove alone (75.2%), carpooled (9.9%), walked to work (2.1%), public transportation (2.0%), worked from home (7.8%)
Bill Morrow // Wikimedia Commons
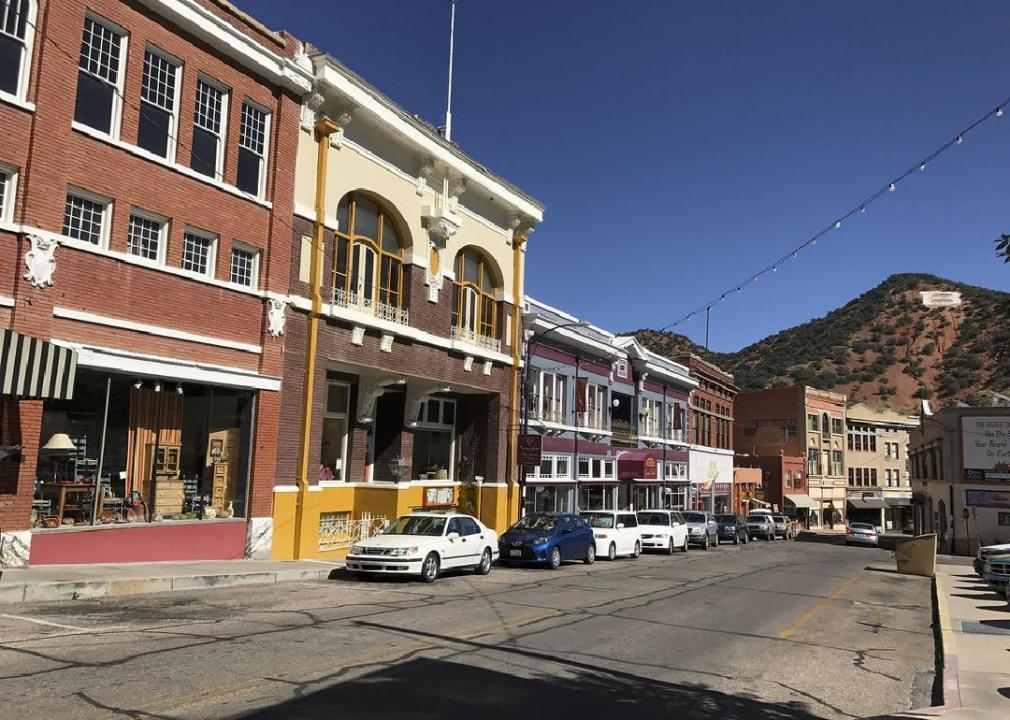
#12. Greenlee County
– Workers with 90+ minute commute: 1.8%
— 60+ minute commute: 3.0%
– Average commute time: 17.9 minutes
— 7.9 minutes shorter than state average
– Left for work from 12 a.m. to 6 a.m.: 51.5%
– Worked outside county of residence: 2.7%
– Means of transportation: drove alone (84.4%), carpooled (12.3%), walked to work (1.6%), public transportation (0.0%), worked from home (1.1%)
Clay Gilliland // Flickr
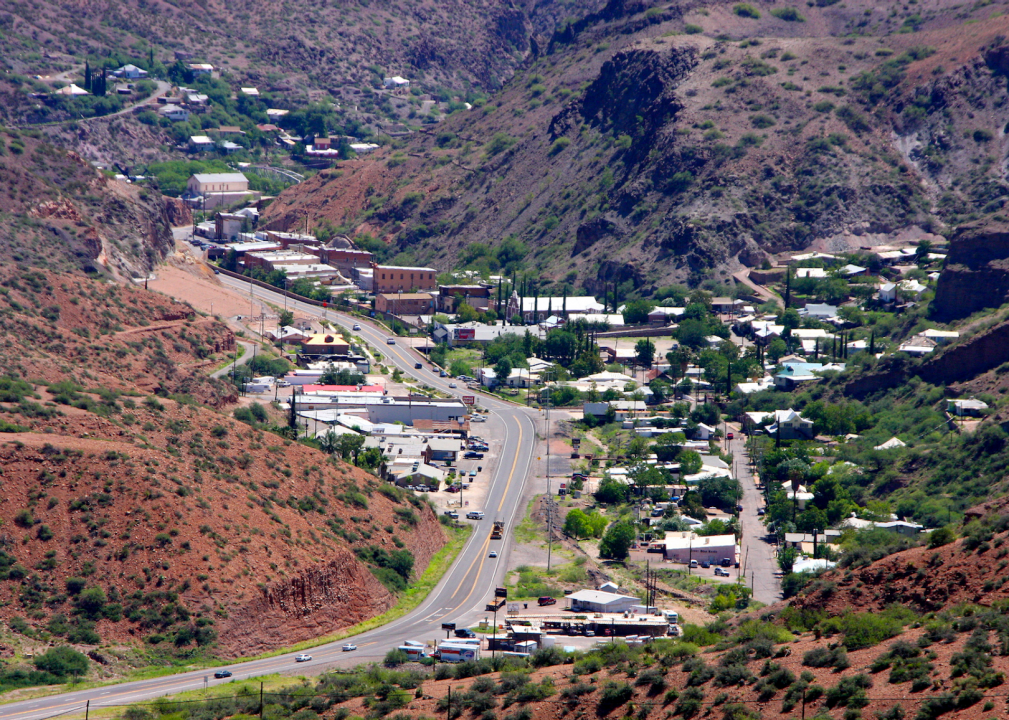
#11. Cochise County
– Workers with 90+ minute commute: 2.1%
— 60+ minute commute: 6.4%
– Average commute time: 21.2 minutes
— 4.6 minutes shorter than state average
– Left for work from 12 a.m. to 6 a.m.: 21.0%
– Worked outside county of residence: 5.8%
– Means of transportation: drove alone (78.6%), carpooled (9.1%), walked to work (3.0%), public transportation (0.5%), worked from home (6.0%)
You may also like: Best community colleges in Arizona
Ken Lund // Flickr
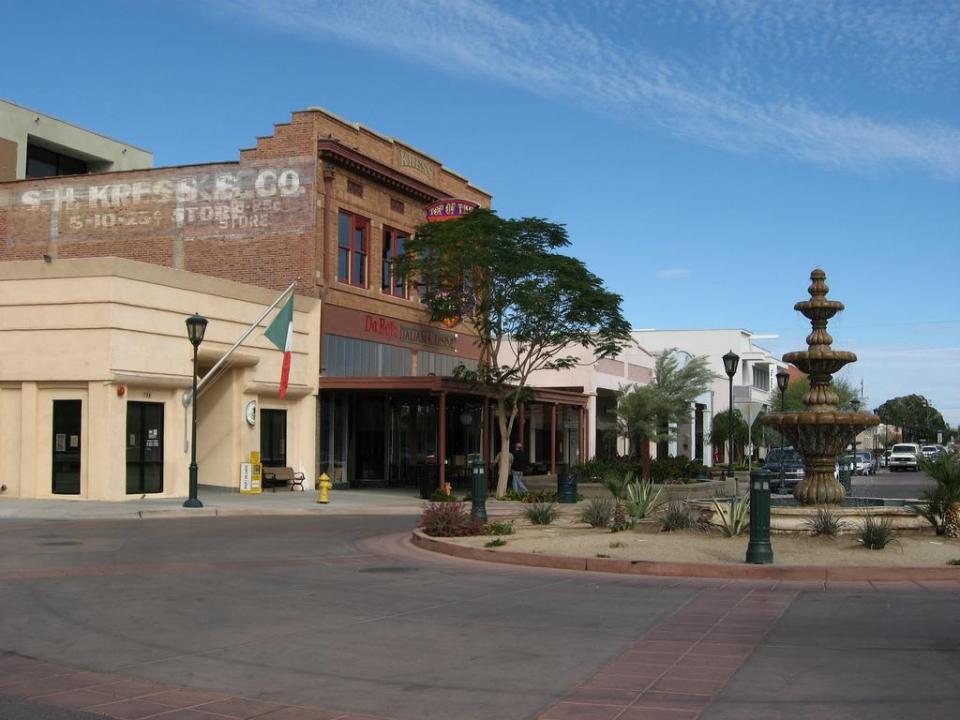
#10. Yuma County
– Workers with 90+ minute commute: 2.1%
— 60+ minute commute: 4.9%
– Average commute time: 20.7 minutes
— 5.1 minutes shorter than state average
– Left for work from 12 a.m. to 6 a.m.: 26.1%
– Worked outside county of residence: 1.2%
– Means of transportation: drove alone (78.9%), carpooled (12.3%), walked to work (2.0%), public transportation (1.8%), worked from home (3.5%)

HildaWeges Photography // Shutterstock
#9. Coconino County
– Workers with 90+ minute commute: 2.3%
— 60+ minute commute: 5.0%
– Average commute time: 18.6 minutes
— 7.2 minutes shorter than state average
– Left for work from 12 a.m. to 6 a.m.: 13.6%
– Worked outside county of residence: 5.2%
– Means of transportation: drove alone (69.9%), carpooled (10.6%), walked to work (8.4%), public transportation (1.6%), worked from home (6.9%)
zeesstof // Wikimedia Commons
#8. Pinal County
– Workers with 90+ minute commute: 2.6%
— 60+ minute commute: 13.4%
– Average commute time: 31.5 minutes
— 5.7 minutes longer than state average
– Left for work from 12 a.m. to 6 a.m.: 28.6%
– Worked outside county of residence: 46.4%
– Means of transportation: drove alone (77.0%), carpooled (11.6%), walked to work (1.4%), public transportation (0.2%), worked from home (8.0%)
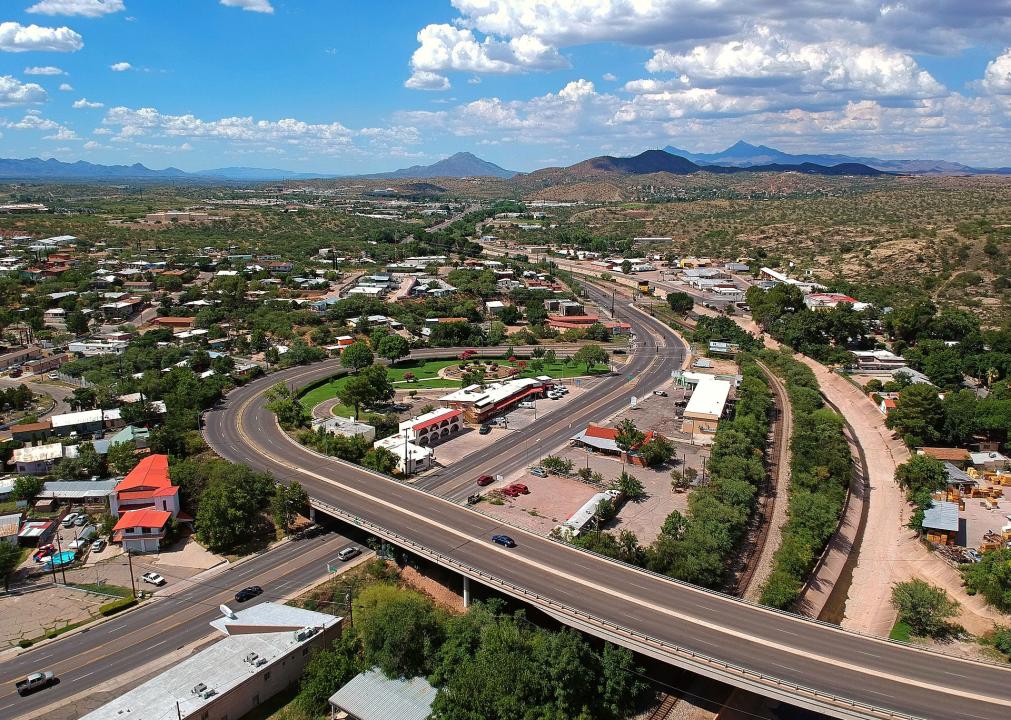
Elnogalense // Wikimedia Commons
#7. Santa Cruz County
– Workers with 90+ minute commute: 3.1%
— 60+ minute commute: 10.3%
– Average commute time: 22.8 minutes
— 3.0 minutes shorter than state average
– Left for work from 12 a.m. to 6 a.m.: 18.5%
– Worked outside county of residence: 15.1%
– Means of transportation: drove alone (80.2%), carpooled (10.2%), walked to work (1.2%), public transportation (1.1%), worked from home (4.4%)
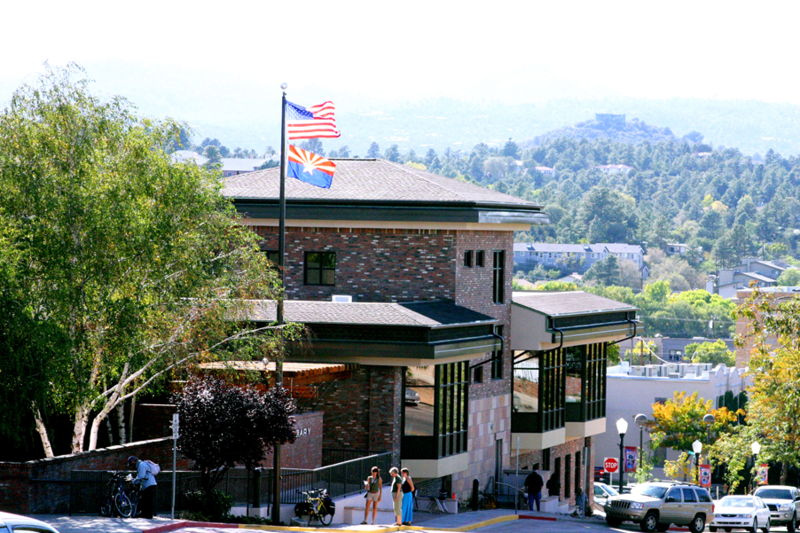
Martha.baden // Wikimedia
#6. Yavapai County
– Workers with 90+ minute commute: 3.3%
— 60+ minute commute: 7.1%
– Average commute time: 23.2 minutes
— 2.6 minutes shorter than state average
– Left for work from 12 a.m. to 6 a.m.: 16.3%
– Worked outside county of residence: 6.5%
– Means of transportation: drove alone (76.1%), carpooled (10.3%), walked to work (3.5%), public transportation (0.2%), worked from home (8.0%)
You may also like: Where people in Arizona are moving to most

InSapphoWeTrust // Wikicommons
#5. Mohave County
– Workers with 90+ minute commute: 3.3%
— 60+ minute commute: 7.9%
– Average commute time: 21.8 minutes
— 4.0 minutes shorter than state average
– Left for work from 12 a.m. to 6 a.m.: 19.6%
– Worked outside county of residence: 1.4%
– Means of transportation: drove alone (78.3%), carpooled (11.7%), walked to work (1.1%), public transportation (0.9%), worked from home (5.2%)
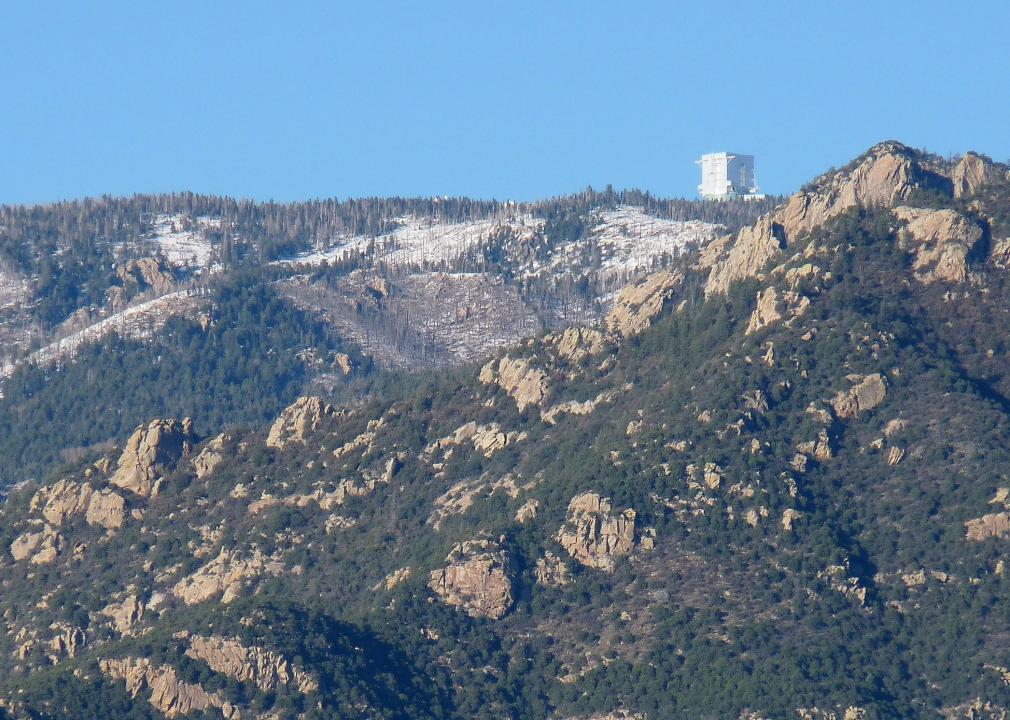
Wars // Wikimedia Commons
#4. Graham County
– Workers with 90+ minute commute: 3.4%
— 60+ minute commute: 12.2%
– Average commute time: 22.9 minutes
— 2.9 minutes shorter than state average
– Left for work from 12 a.m. to 6 a.m.: 31.1%
– Worked outside county of residence: 17.8%
– Means of transportation: drove alone (78.3%), carpooled (14.8%), walked to work (1.4%), public transportation (0.2%), worked from home (4.2%)
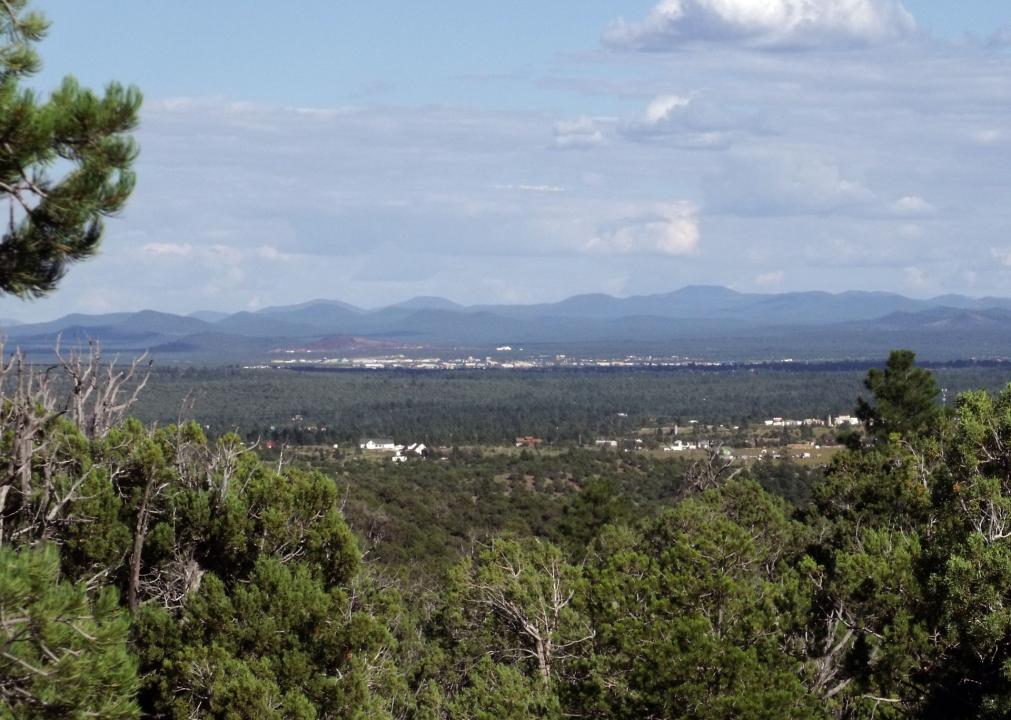
Ixnayonthetimmay // Wikimedia Commons
#3. Navajo County
– Workers with 90+ minute commute: 3.8%
— 60+ minute commute: 8.6%
– Average commute time: 22.1 minutes
— 3.7 minutes shorter than state average
– Left for work from 12 a.m. to 6 a.m.: 17.3%
– Worked outside county of residence: 8.7%
– Means of transportation: drove alone (75.1%), carpooled (10.0%), walked to work (4.8%), public transportation (1.2%), worked from home (6.8%)
Andreas F. Borchert // Wikimedia Commons
#2. Apache County
– Workers with 90+ minute commute: 5.1%
— 60+ minute commute: 13.6%
– Average commute time: 27.3 minutes
— 1.5 minutes longer than state average
– Left for work from 12 a.m. to 6 a.m.: 18.3%
– Worked outside county of residence: 11.8%
– Means of transportation: drove alone (77.2%), carpooled (7.2%), walked to work (3.9%), public transportation (1.4%), worked from home (8.3%)

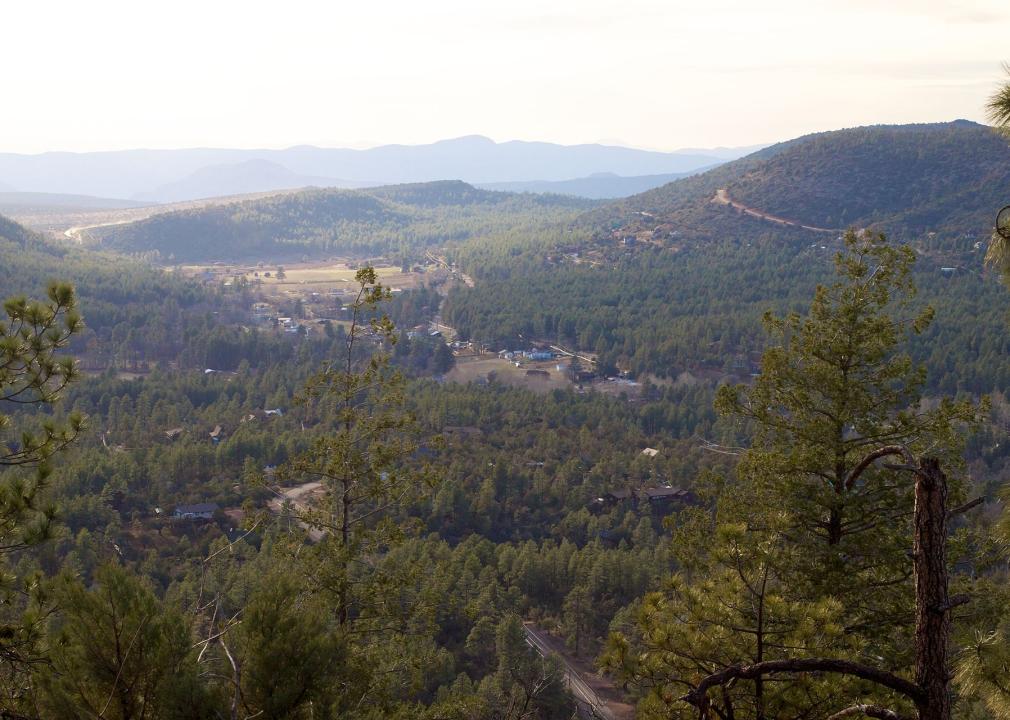
Alan Levine // Wikimedia Commons
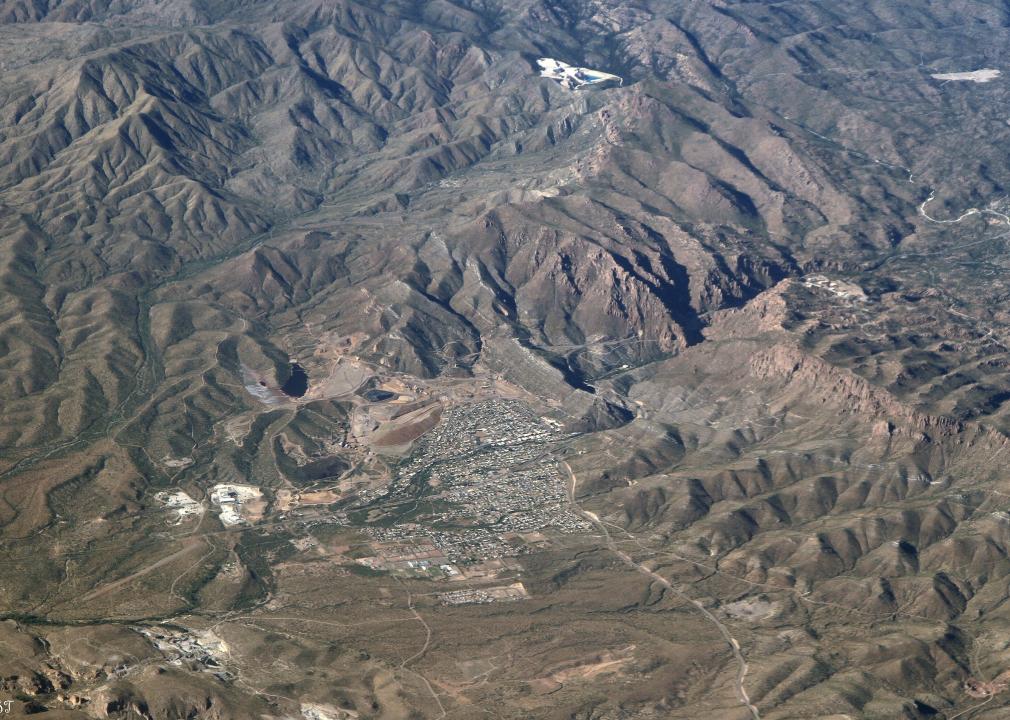
#1. Gila County
– Workers with 90+ minute commute: 5.6%
— 60+ minute commute: 8.7%
– Average commute time: 20 minutes
— 5.8 minutes shorter than state average
– Left for work from 12 a.m. to 6 a.m.: 23.1%
– Worked outside county of residence: 15.2%
– Means of transportation: drove alone (77.7%), carpooled (13.3%), walked to work (1.6%), public transportation (0.1%), worked from home (6.6%)
You may also like: Recipes from Arizona