Counties with the highest rate of food insecurity in Arizona

Andreas F. Borchert // Wikimedia Commons
Counties with the highest rate of food insecurity in Arizona
Every county in the United States is home to people experiencing food insecurity, defined by the nonprofit Feeding America as “a lack of consistent access to enough food for every person in a household to live an active, healthy life.”
The USDA estimates that 89.5% of U.S. households were food secure throughout 2019—that’s 116.0 million people. The COVID-19 pandemic put further strain on households already experiencing food hardship, with Feeding America estimating that 42 million people, or 1 in 8 Americans, may experience food insecurity in 2021. This is a slight improvement from 2020 numbers but still represents an enormous burden for millions of children and adults.
Stacker compiled a list of counties in Arizona with the highest rate of food insecurity using data from Feeding America. Counties are ranked by highest percent of population with food insecurity as of 2019.
![]()

Sean Pavone // Shutterstock
#15. Maricopa County
– Food insecurity rate: 11.7% (506,640 total)
— 7.3% higher than national average
– Child food insecurity rate: 16.3% (170,210 total)
— 11.6% higher than national average
– Annual food budget shortfall: $281,762,000
— Cost per meal: $3.25
zeesstof // Wikimedia Commons
#14. Pinal County
– Food insecurity rate: 12.0% (51,730 total)
— 10.1% higher than national average
– Child food insecurity rate: 17.8% (17,640 total)
— 21.9% higher than national average
– Annual food budget shortfall: $27,789,000
— Cost per meal: $3.14
Bill Morrow // Wikimedia Commons
#13. Greenlee County
– Food insecurity rate: 12.2% (1,160 total)
— 11.9% higher than national average
– Child food insecurity rate: 15.5% (410 total)
— 6.2% higher than national average
– Annual food budget shortfall: $623,000
— Cost per meal: $3.14

Jay Yuan // Shutterstock
#12. Pima County
– Food insecurity rate: 13.3% (136,740 total)
— 22.0% higher than national average
– Child food insecurity rate: 18.9% (40,990 total)
— 29.5% higher than national average
– Annual food budget shortfall: $75,319,000
— Cost per meal: $3.22
Martha.baden // Wikimedia
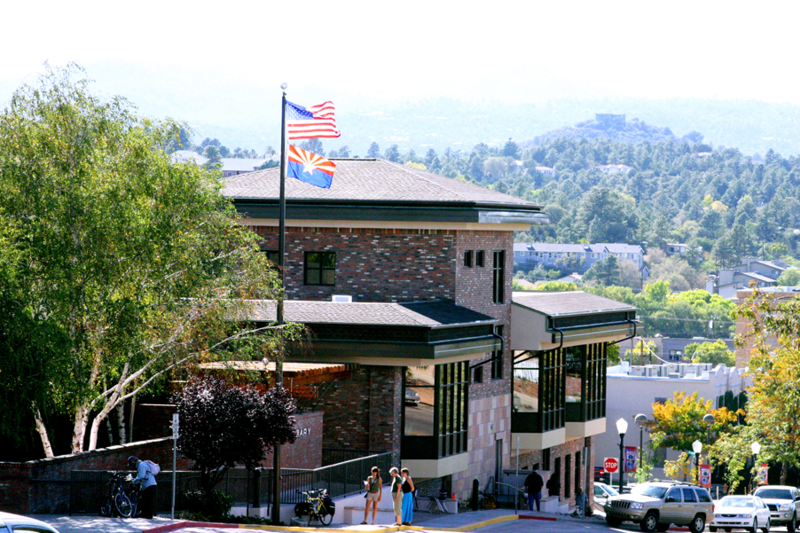
#11. Yavapai County
– Food insecurity rate: 13.8% (31,400 total)
— 26.6% higher than national average
– Child food insecurity rate: 18.8% (7,100 total)
— 28.8% higher than national average
– Annual food budget shortfall: $18,231,000
— Cost per meal: $3.40

Clay Gilliland // Flickr
#10. Cochise County
– Food insecurity rate: 14.2% (17,830 total)
— 30.3% higher than national average
– Child food insecurity rate: 21.4% (5,870 total)
— 46.6% higher than national average
– Annual food budget shortfall: $9,332,000
— Cost per meal: $3.06
Elnogalense // Wikimedia Commons
#9. Santa Cruz County
– Food insecurity rate: 14.6% (6,760 total)
— 33.9% higher than national average
– Child food insecurity rate: 22.6% (2,880 total)
— 54.8% higher than national average
– Annual food budget shortfall: $3,056,000
— Cost per meal: $2.64

HildaWeges Photography // Shutterstock
#8. Coconino County
– Food insecurity rate: 14.6% (20,700 total)
— 33.9% higher than national average
– Child food insecurity rate: 18.3% (5,360 total)
— 25.3% higher than national average
– Annual food budget shortfall: $12,019,000
— Cost per meal: $3.40

Wars // Wikimedia Commons
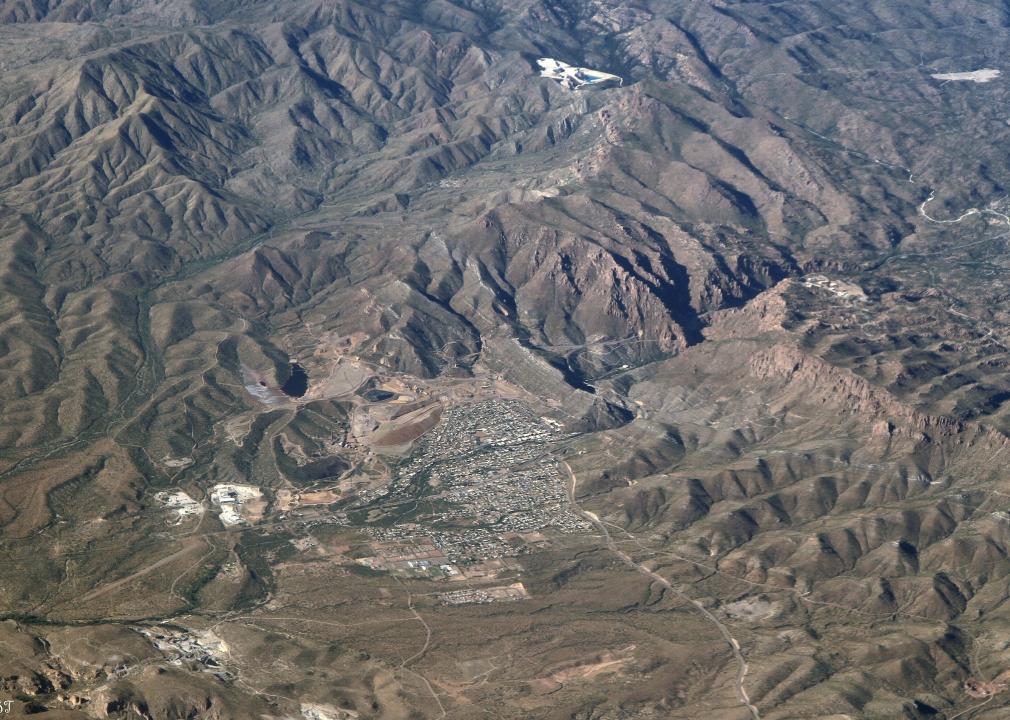
#7. Graham County
– Food insecurity rate: 14.8% (5,630 total)
— 35.8% higher than national average
– Child food insecurity rate: 21.2% (2,180 total)
— 45.2% higher than national average
– Annual food budget shortfall: $2,916,000
— Cost per meal: $3.03

InSapphoWeTrust // Wikicommons
#6. Mohave County
– Food insecurity rate: 16.7% (34,740 total)
— 53.2% higher than national average
– Child food insecurity rate: 24.5% (8,890 total)
— 67.8% higher than national average
– Annual food budget shortfall: $18,983,000
— Cost per meal: $3.20
Alan Levine // Wikimedia Commons
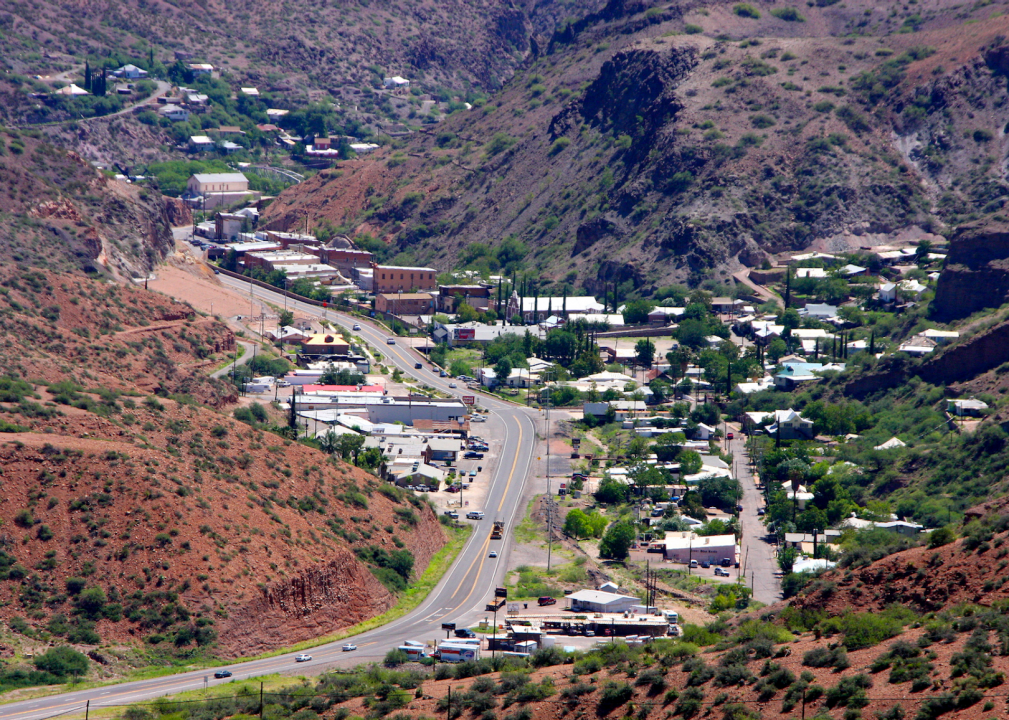
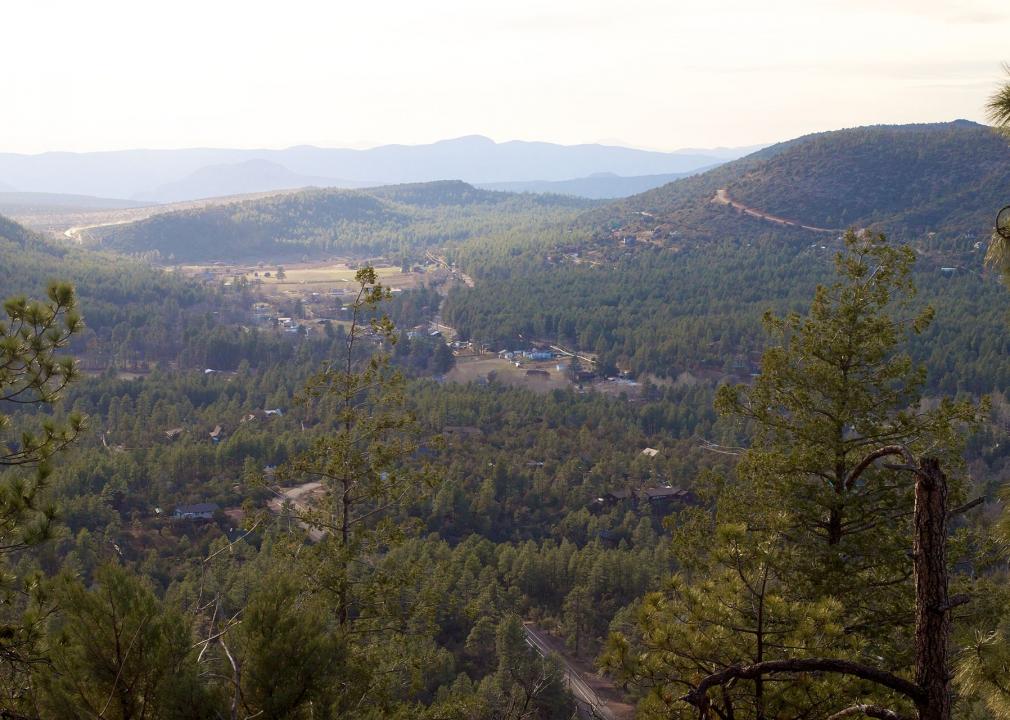
#5. Gila County
– Food insecurity rate: 17.5% (9,350 total)
— 60.6% higher than national average
– Child food insecurity rate: 27.7% (2,980 total)
— 89.7% higher than national average
– Annual food budget shortfall: $5,108,000
— Cost per meal: $3.20
Ken L. // Flickr
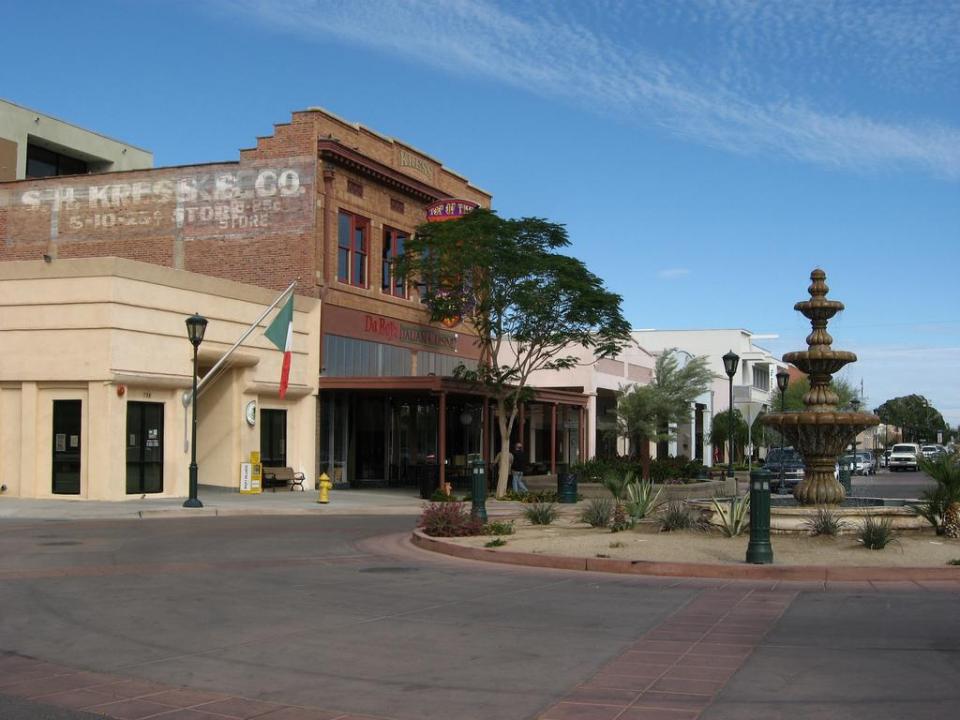
#4. Yuma County
– Food insecurity rate: 18.2% (38,200 total)
— 67.0% higher than national average
– Child food insecurity rate: 29.5% (15,710 total)
— 102.1% higher than national average
– Annual food budget shortfall: $18,314,000
— Cost per meal: $2.80
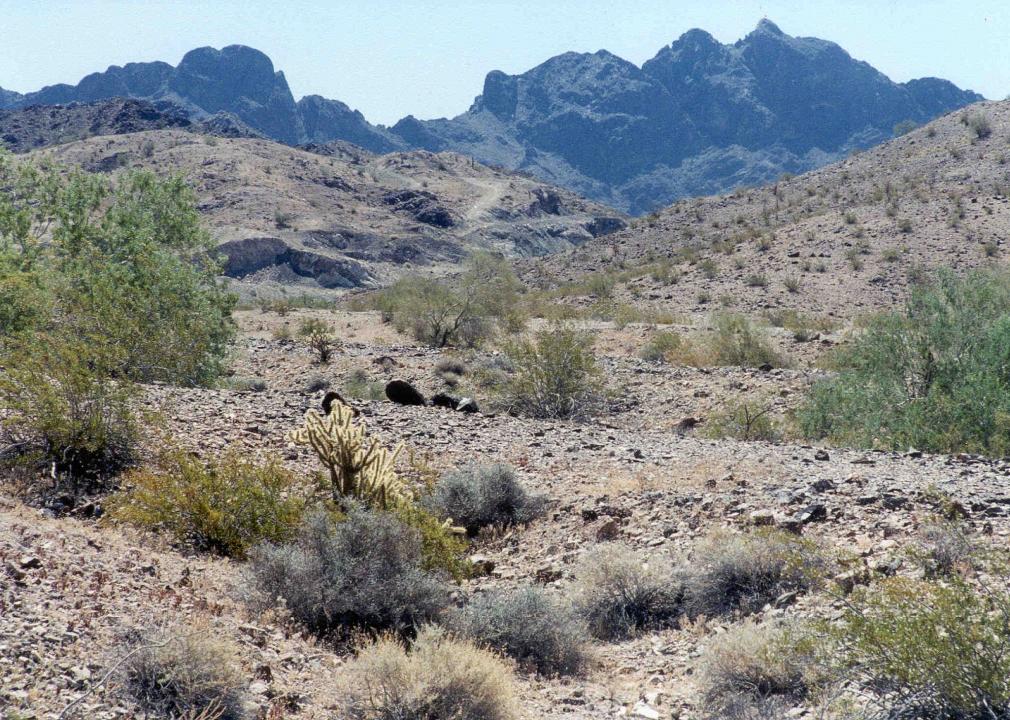
United States Bureau of Land Management // Wikimedia Commons
#3. La Paz County
– Food insecurity rate: 18.6% (3,870 total)
— 70.6% higher than national average
– Child food insecurity rate: 28.2% (960 total)
— 93.2% higher than national average
– Annual food budget shortfall: $2,091,000
— Cost per meal: $3.16

Ixnayonthetimmay // Wikimedia Commons
#2. Navajo County
– Food insecurity rate: 20.7% (22,650 total)
— 89.9% higher than national average
– Child food insecurity rate: 29.6% (8,720 total)
— 102.7% higher than national average
– Annual food budget shortfall: $11,815,000
— Cost per meal: $3.05

Andreas F. Borchert // Wikimedia Commons
#1. Apache County
– Food insecurity rate: 23.6% (16,900 total)
— 116.5% higher than national average
– Child food insecurity rate: 33.5% (6,550 total)
— 129.5% higher than national average
– Annual food budget shortfall: $9,465,000
— Cost per meal: $3.28