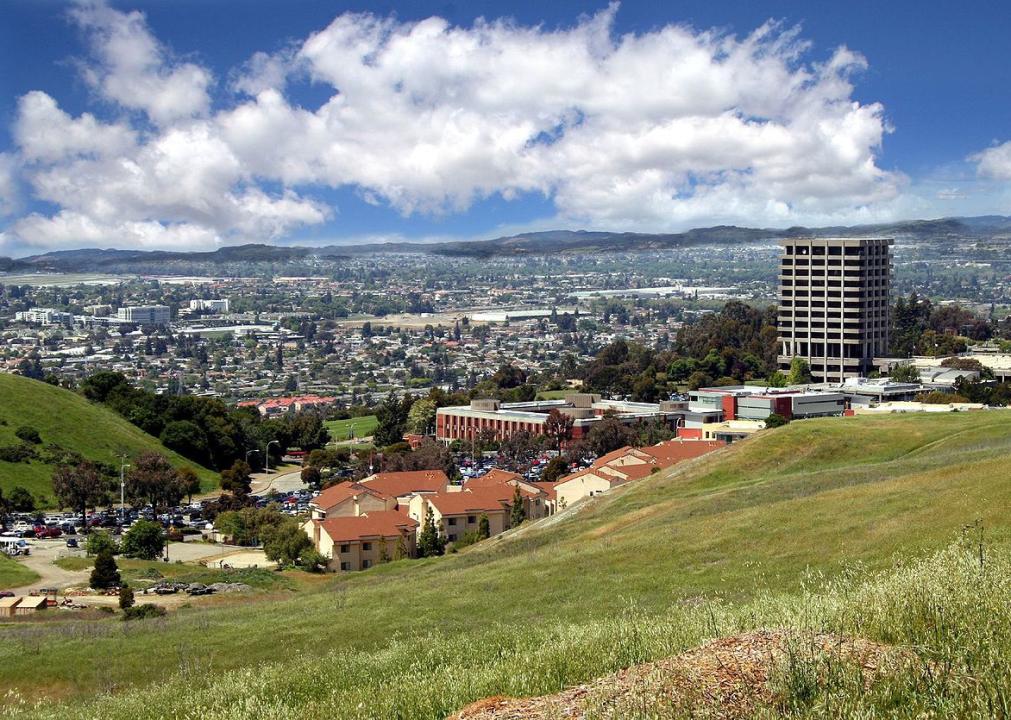
Counties with the most super commuters in California
LPS.1 // Wikicommons
Counties with the most super commuters in California
There are more than 283 million vehicles on the road in the United States, and many of those cars, trucks, vans, and motorcycles are used to ferry people to and from their homes and jobs during their daily commutes. A small but growing number of people are walking and biking to work, particularly in compact college towns. Many more take public transportation, especially in major cities like New York, Chicago, San Francisco, Washington D.C., Boston, and Seattle—but nationwide, public transit accounts for only about 5% of daily commutes.
The overwhelming majority of people still drive to and from work every day, and the vast majority of those car commuters drive alone—fewer than 10% of Americans carpool. According to the U.S. Census Bureau, the average one-way commute in the United States has grown to a record 26.9 minutes. That’s just shy of an hour a day that average Americans squander behind the wheel, not at home with their families, and instead, burning gas and putting miles on their cars.
For some Americans, however, the commute to work is far from average. A phenomenon known as super commuting has emerged and grown in recent years. Super commuters spend 90 minutes or more—each way—chasing their paychecks every day. The biggest percentage of super commuters work in the extraction industry, with workers pursuing lucrative jobs in remote mines, oil fields, and other energy operations. Many more, however, have been priced out of expensive housing in urban metro areas where high-paying jobs are located, far away from their less-expensive county of residence.
Stacker compiled a list of counties with the most super commuters in California using data from the U.S. Census Bureau. Counties are ranked by the highest percent of workers with a commute over 90 minutes, based on 2020 5-year estimates. Keep reading to see where in your state people are spending the most time going to and from work every day.
You may also like: Cities with the most expensive homes in California
![]()

clr_flickr from Rocklin, USA // Wikimedia Commons
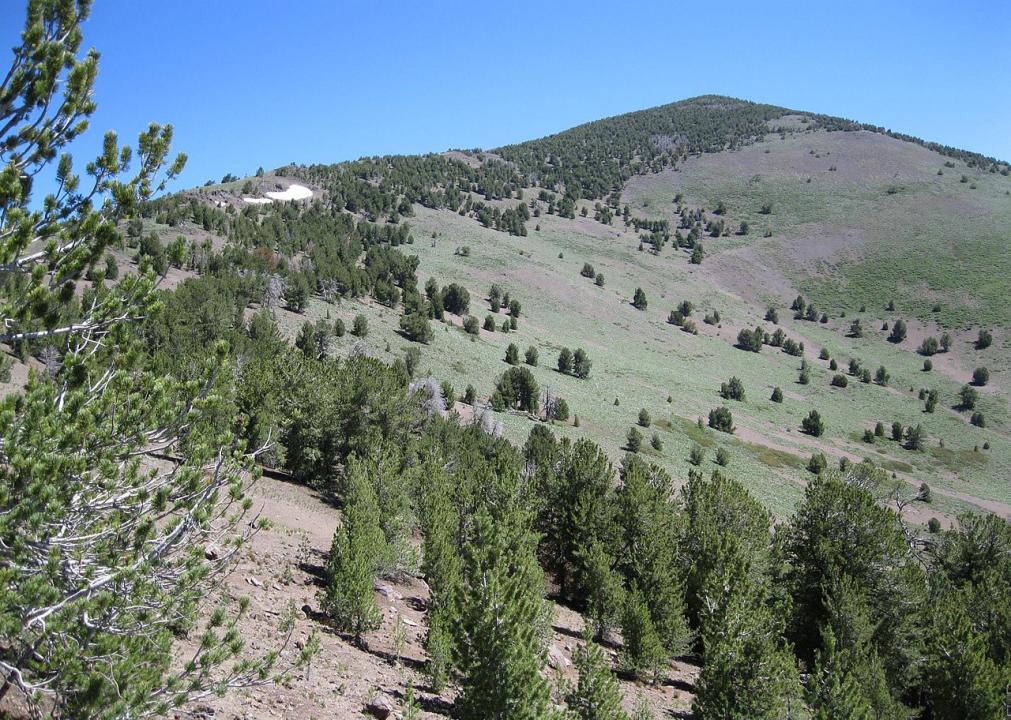
#58. Mono County
– Workers with 90+ minute commute: 0.7%
— 60+ minute commute: 3.0%
– Average commute time: 15.6 minutes
— 14.2 minutes shorter than state average
– Left for work from 12 a.m. to 6 a.m.: 10.4%
– Worked outside county of residence: 9.2%
– Means of transportation: drove alone (55.0%), carpooled (13.3%), walked to work (5.5%), public transportation (15.9%), worked from home (7.7%)

Chuck Abbe // Wikimedia Commons
#57. Inyo County
– Workers with 90+ minute commute: 1.4%
— 60+ minute commute: 3.6%
– Average commute time: 17.1 minutes
— 12.7 minutes shorter than state average
– Left for work from 12 a.m. to 6 a.m.: 18.0%
– Worked outside county of residence: 11.8%
– Means of transportation: drove alone (69.2%), carpooled (13.7%), walked to work (6.2%), public transportation (0.8%), worked from home (4.9%)
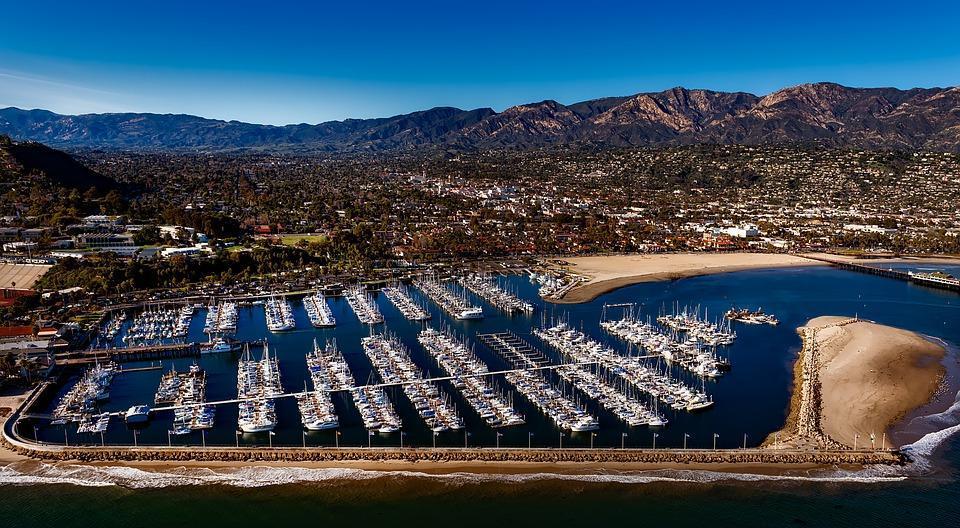
Pixabay
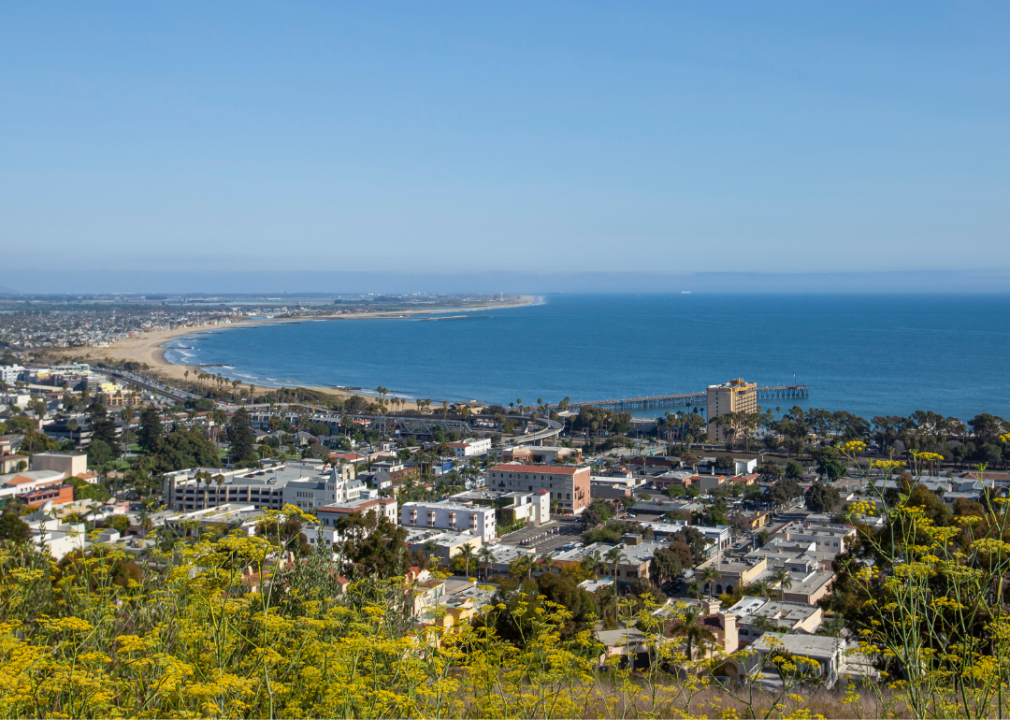
#56. Santa Barbara County
– Workers with 90+ minute commute: 1.6%
— 60+ minute commute: 5.1%
– Average commute time: 20.6 minutes
— 9.2 minutes shorter than state average
– Left for work from 12 a.m. to 6 a.m.: 12.5%
– Worked outside county of residence: 6.5%
– Means of transportation: drove alone (68.1%), carpooled (13.1%), walked to work (3.9%), public transportation (2.9%), worked from home (8.0%)
Canva
#55. Tulare County
– Workers with 90+ minute commute: 1.7%
— 60+ minute commute: 5.3%
– Average commute time: 22 minutes
— 7.8 minutes shorter than state average
– Left for work from 12 a.m. to 6 a.m.: 22.6%
– Worked outside county of residence: 15.7%
– Means of transportation: drove alone (78.8%), carpooled (13.4%), walked to work (1.4%), public transportation (0.6%), worked from home (4.3%)
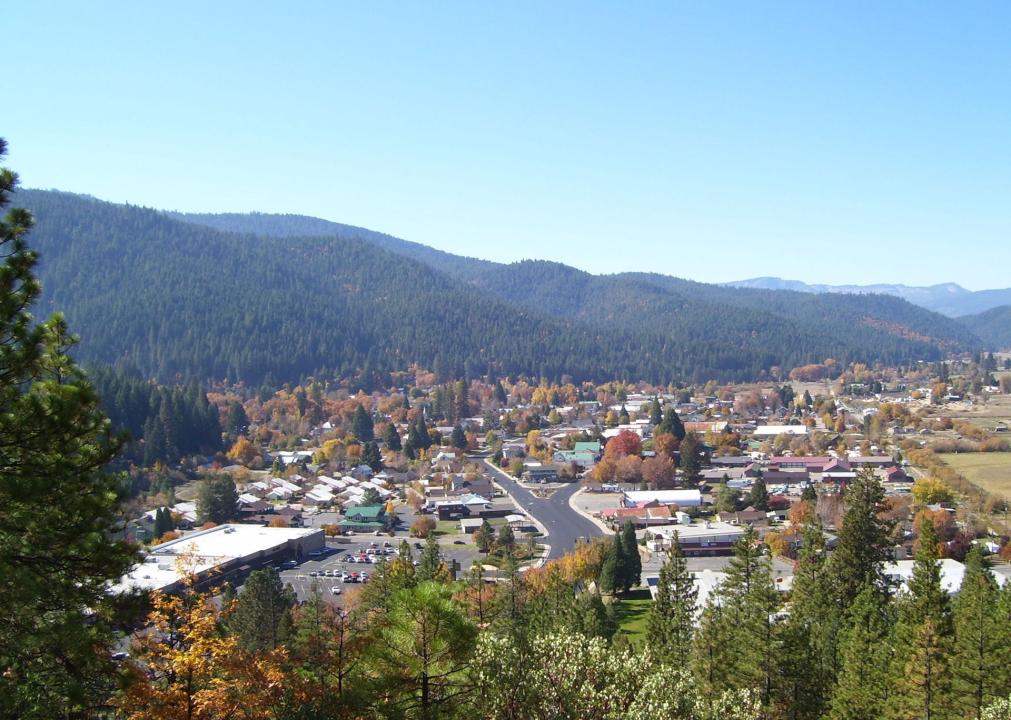
Kenneth Green // Wikimedia Commons
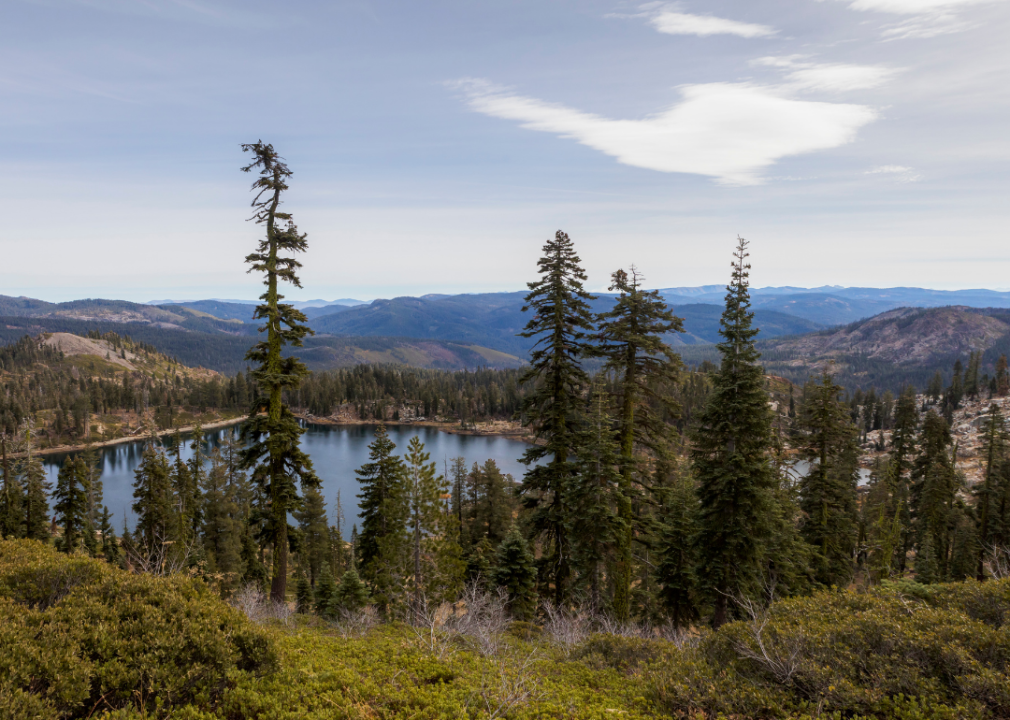
#54. Plumas County
– Workers with 90+ minute commute: 1.8%
— 60+ minute commute: 9.0%
– Average commute time: 19.4 minutes
— 10.4 minutes shorter than state average
– Left for work from 12 a.m. to 6 a.m.: 18.5%
– Worked outside county of residence: 6.7%
– Means of transportation: drove alone (79.6%), carpooled (7.9%), walked to work (4.3%), public transportation (0.8%), worked from home (6.3%)
You may also like: Highest rated beer in California
Chmee2 // Wikimedia Commons
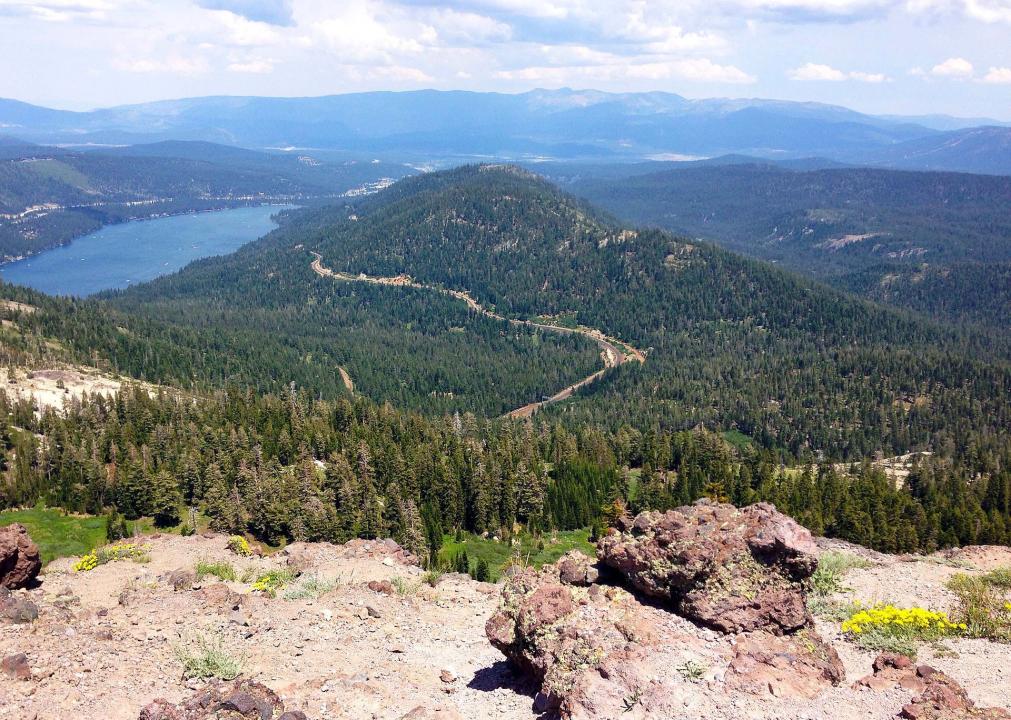
#53. Siskiyou County
– Workers with 90+ minute commute: 1.8%
— 60+ minute commute: 4.3%
– Average commute time: 18.4 minutes
— 11.4 minutes shorter than state average
– Left for work from 12 a.m. to 6 a.m.: 12.1%
– Worked outside county of residence: 4.3%
– Means of transportation: drove alone (76.1%), carpooled (8.5%), walked to work (4.3%), public transportation (0.2%), worked from home (9.4%)
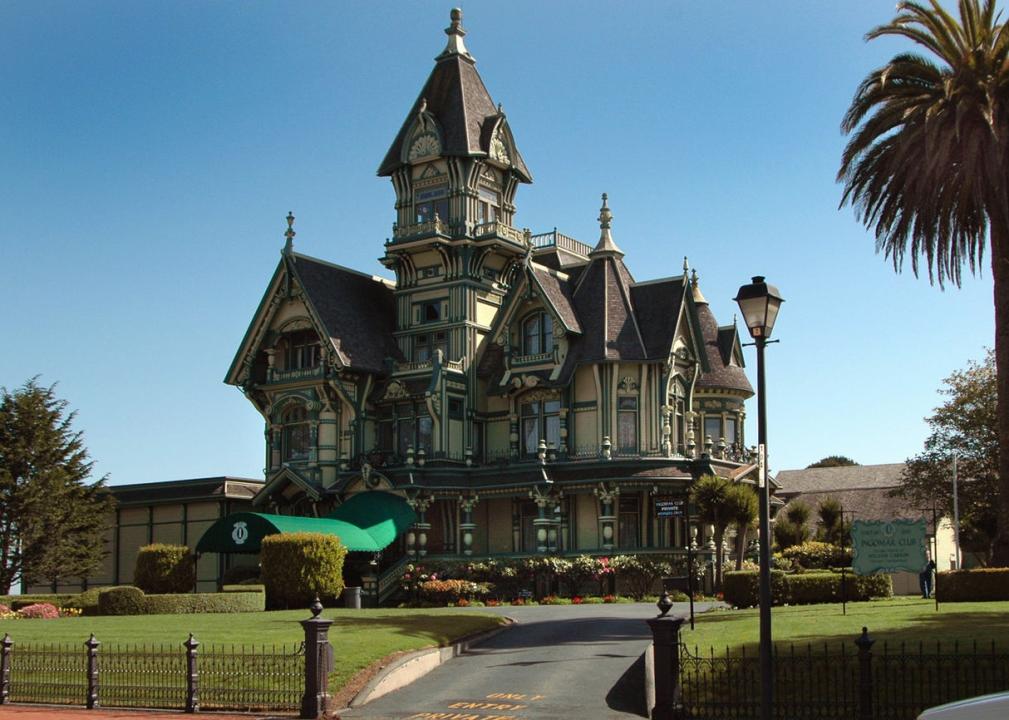
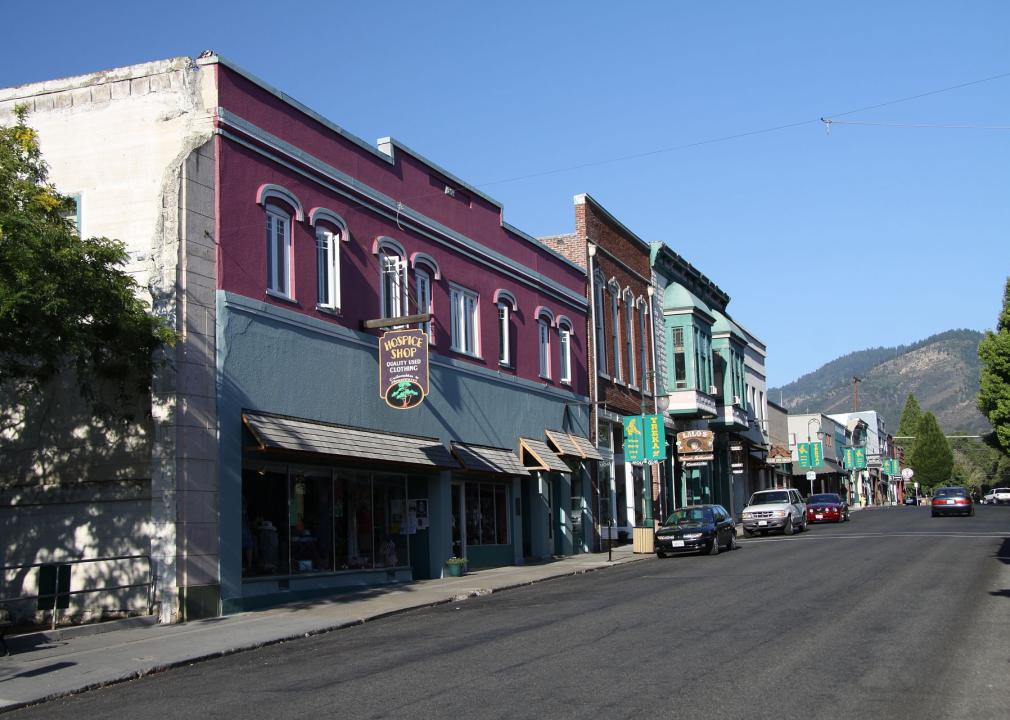
Cory Maylett // Wikimedia Commons
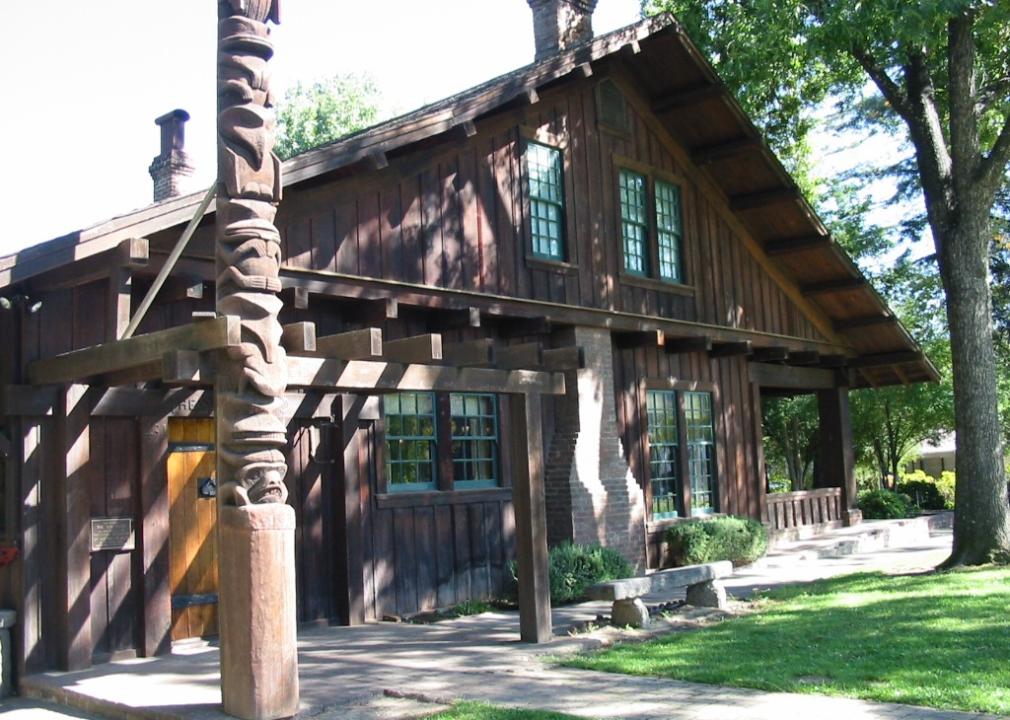
#52. Humboldt County
– Workers with 90+ minute commute: 1.9%
— 60+ minute commute: 4.7%
– Average commute time: 18.9 minutes
— 10.9 minutes shorter than state average
– Left for work from 12 a.m. to 6 a.m.: 9.6%
– Worked outside county of residence: 1.3%
– Means of transportation: drove alone (70.5%), carpooled (10.9%), walked to work (6.2%), public transportation (1.7%), worked from home (8.5%)
Craig Howell // Wikimedia Commons
#51. San Mateo County
– Workers with 90+ minute commute: 2.1%
— 60+ minute commute: 10.9%
– Average commute time: 29.4 minutes
— 0.4 minutes shorter than state average
– Left for work from 12 a.m. to 6 a.m.: 9.0%
– Worked outside county of residence: 40.1%
– Means of transportation: drove alone (65.0%), carpooled (9.9%), walked to work (2.4%), public transportation (10.1%), worked from home (9.5%)
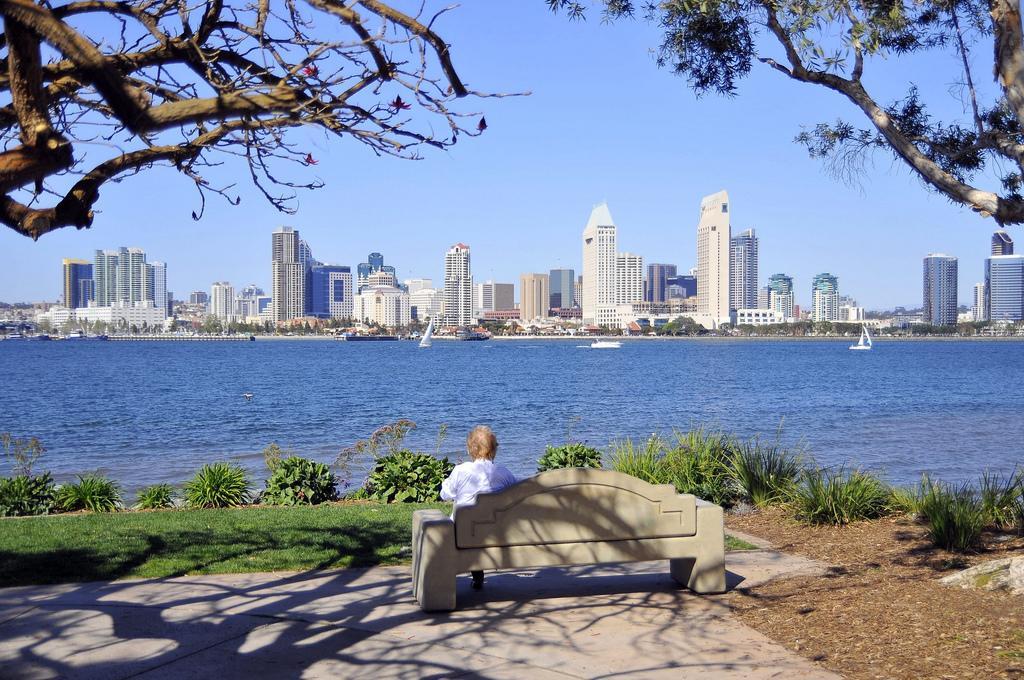
SD Dirk // Flickr
#50. San Diego County
– Workers with 90+ minute commute: 2.2%
— 60+ minute commute: 7.3%
– Average commute time: 26.5 minutes
— 3.3 minutes shorter than state average
– Left for work from 12 a.m. to 6 a.m.: 15.5%
– Worked outside county of residence: 1.9%
– Means of transportation: drove alone (73.9%), carpooled (8.7%), walked to work (2.9%), public transportation (2.6%), worked from home (9.6%)
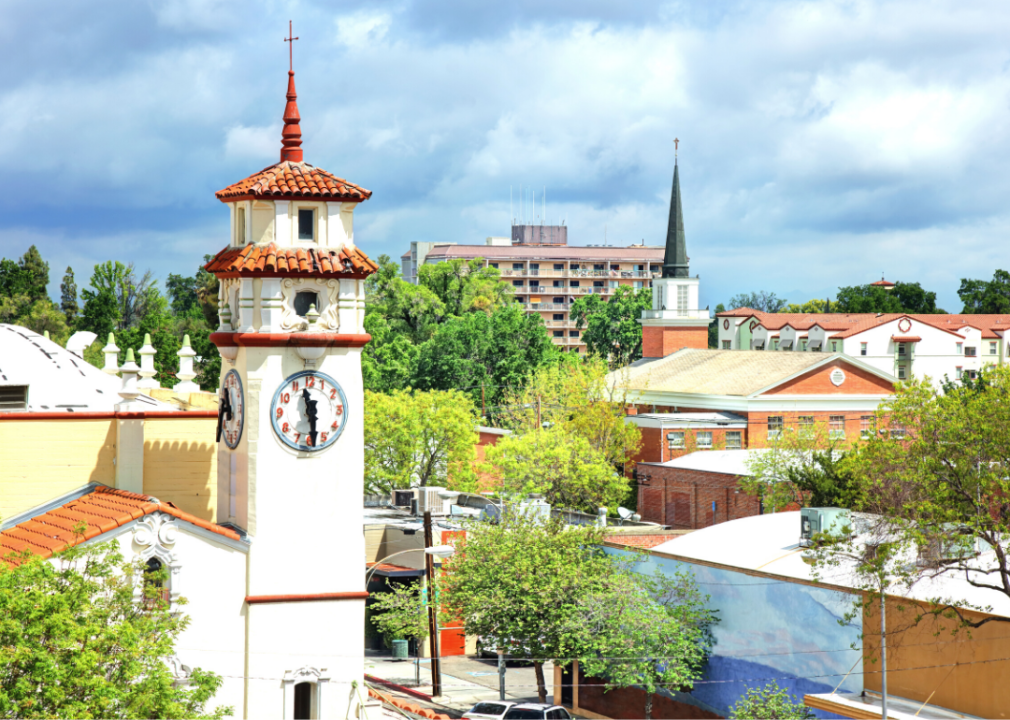
David Jordan // Wikicommons
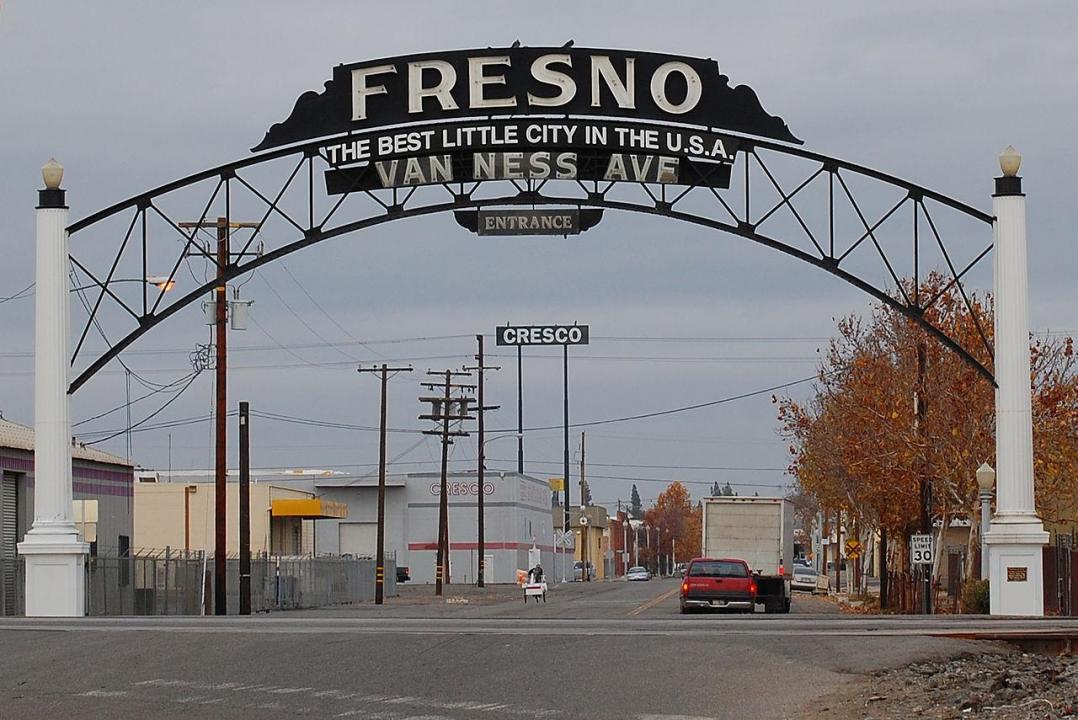
#49. Fresno County
– Workers with 90+ minute commute: 2.3%
— 60+ minute commute: 5.3%
– Average commute time: 23.3 minutes
— 6.5 minutes shorter than state average
– Left for work from 12 a.m. to 6 a.m.: 17.0%
– Worked outside county of residence: 8.9%
– Means of transportation: drove alone (78.3%), carpooled (11.9%), walked to work (1.5%), public transportation (0.9%), worked from home (5.6%)
You may also like: Counties with the highest rate of food insecurity in California
Armona // Wikicommons
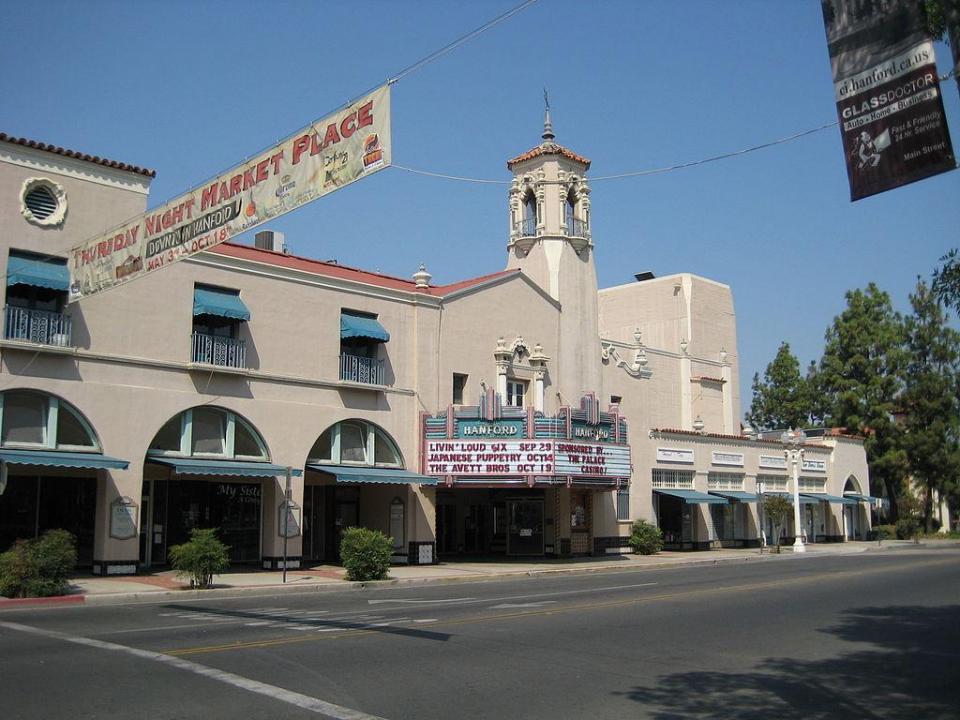
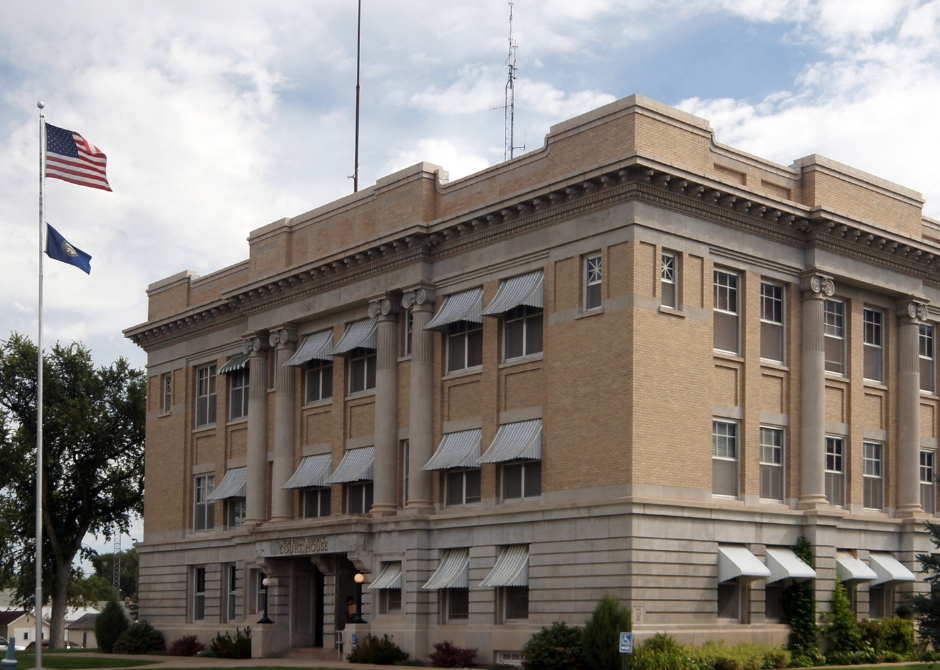
#48. Kings County
– Workers with 90+ minute commute: 2.4%
— 60+ minute commute: 6.1%
– Average commute time: 23.2 minutes
— 6.6 minutes shorter than state average
– Left for work from 12 a.m. to 6 a.m.: 25.5%
– Worked outside county of residence: 24.1%
– Means of transportation: drove alone (77.4%), carpooled (13.7%), walked to work (1.8%), public transportation (0.3%), worked from home (5.1%)
Basar // Wikicommons
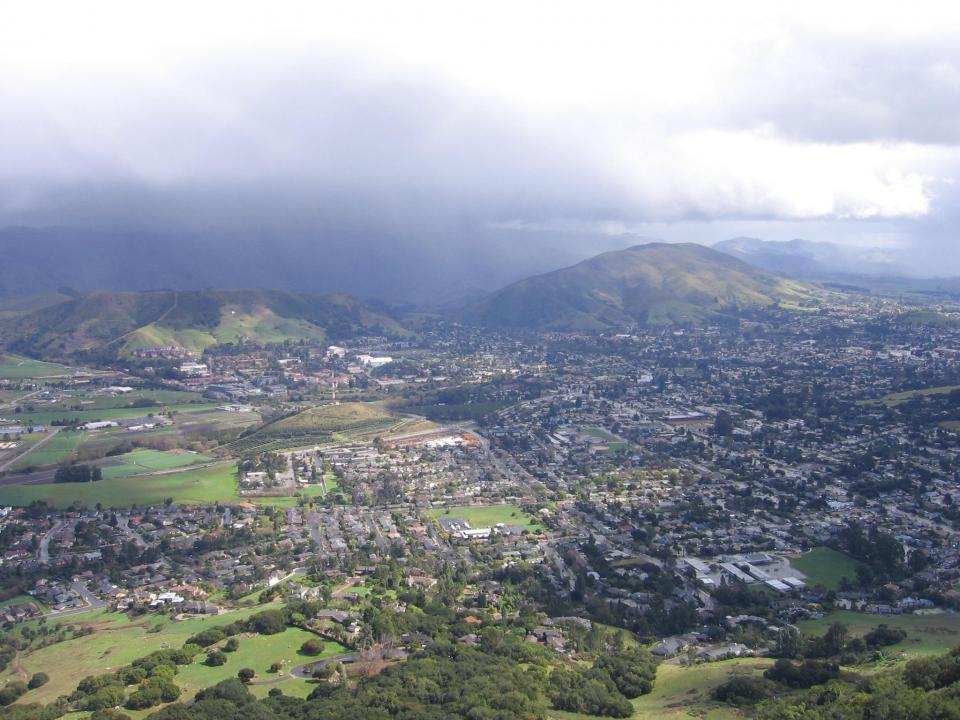
#47. San Luis Obispo County
– Workers with 90+ minute commute: 2.7%
— 60+ minute commute: 4.7%
– Average commute time: 22 minutes
— 7.8 minutes shorter than state average
– Left for work from 12 a.m. to 6 a.m.: 10.8%
– Worked outside county of residence: 9.6%
– Means of transportation: drove alone (72.6%), carpooled (10.1%), walked to work (4.7%), public transportation (1.0%), worked from home (9.0%)
Finetooth // Wikimedia Commons
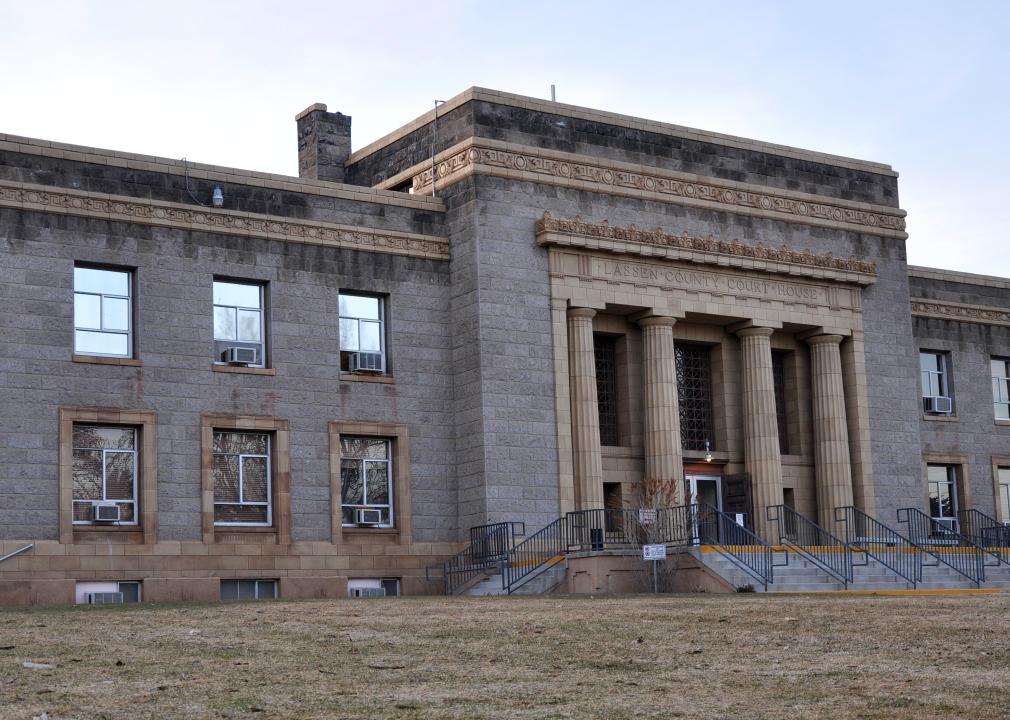
#46. Lassen County
– Workers with 90+ minute commute: 2.7%
— 60+ minute commute: 4.5%
– Average commute time: 21.1 minutes
— 8.7 minutes shorter than state average
– Left for work from 12 a.m. to 6 a.m.: 23.2%
– Worked outside county of residence: 6.4%
– Means of transportation: drove alone (80.7%), carpooled (10.3%), walked to work (2.2%), public transportation (0.3%), worked from home (6.2%)

Naotake Murayama // Wikicommons
#45. Monterey County
– Workers with 90+ minute commute: 2.7%
— 60+ minute commute: 6.2%
– Average commute time: 24 minutes
— 5.8 minutes shorter than state average
– Left for work from 12 a.m. to 6 a.m.: 13.9%
– Worked outside county of residence: 11.8%
– Means of transportation: drove alone (71.4%), carpooled (11.0%), walked to work (2.6%), public transportation (1.3%), worked from home (6.0%)

Canva
#44. Del Norte County
– Workers with 90+ minute commute: 2.9%
— 60+ minute commute: 3.6%
– Average commute time: 15.6 minutes
— 14.2 minutes shorter than state average
– Left for work from 12 a.m. to 6 a.m.: 13.3%
– Worked outside county of residence: 3.2%
– Means of transportation: drove alone (74.4%), carpooled (14.2%), walked to work (4.3%), public transportation (0.3%), worked from home (6.2%)
You may also like: See how low property taxes in California are
Hollywood // Wikimedia Commons
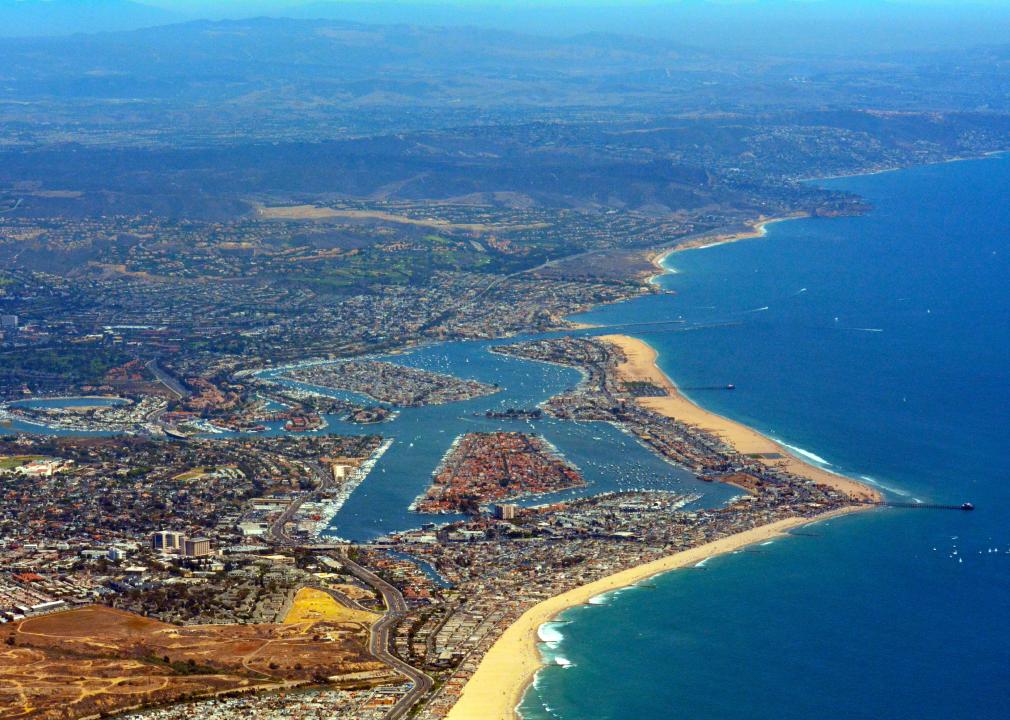
#43. Orange County
– Workers with 90+ minute commute: 3.0%
— 60+ minute commute: 9.5%
– Average commute time: 28 minutes
— 1.8 minutes shorter than state average
– Left for work from 12 a.m. to 6 a.m.: 13.6%
– Worked outside county of residence: 14.5%
– Means of transportation: drove alone (76.1%), carpooled (9.5%), walked to work (1.8%), public transportation (1.8%), worked from home (9.0%)
Canva
#42. Butte County
– Workers with 90+ minute commute: 3.0%
— 60+ minute commute: 5.9%
– Average commute time: 21.3 minutes
— 8.5 minutes shorter than state average
– Left for work from 12 a.m. to 6 a.m.: 14.7%
– Worked outside county of residence: 9.3%
– Means of transportation: drove alone (74.8%), carpooled (10.2%), walked to work (2.9%), public transportation (1.1%), worked from home (7.5%)
nickchapman // Wikicommons
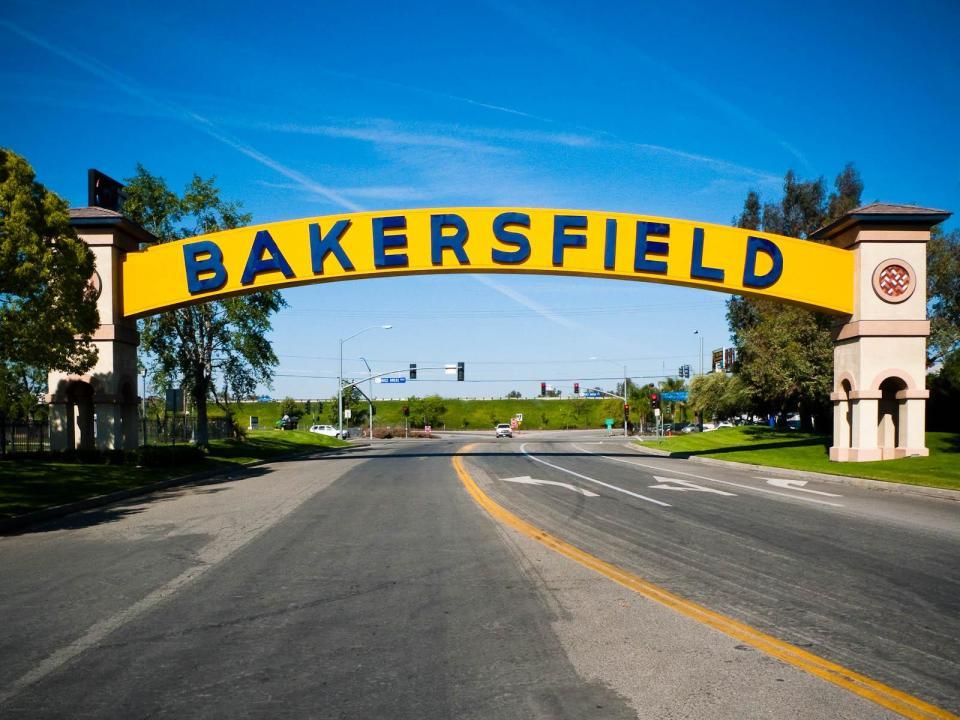
#41. Kern County
– Workers with 90+ minute commute: 3.0%
— 60+ minute commute: 6.5%
– Average commute time: 23.6 minutes
— 6.2 minutes shorter than state average
– Left for work from 12 a.m. to 6 a.m.: 20.3%
– Worked outside county of residence: 6.1%
– Means of transportation: drove alone (80.1%), carpooled (12.2%), walked to work (1.1%), public transportation (0.7%), worked from home (4.5%)

Cbl62 // Wikicommons
#40. Imperial County
– Workers with 90+ minute commute: 3.1%
— 60+ minute commute: 6.3%
– Average commute time: 22.1 minutes
— 7.7 minutes shorter than state average
– Left for work from 12 a.m. to 6 a.m.: 22.7%
– Worked outside county of residence: 7.2%
– Means of transportation: drove alone (79.7%), carpooled (8.8%), walked to work (2.8%), public transportation (0.7%), worked from home (5.9%)
Uladzik Kryhin // Shutterstock
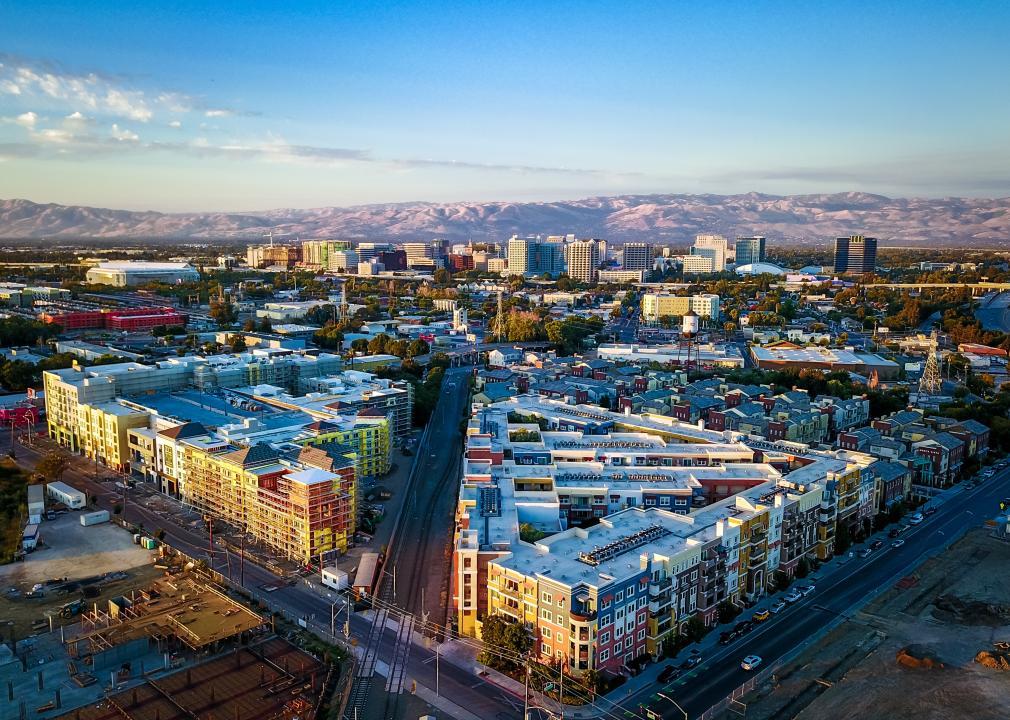
#39. Santa Clara County
– Workers with 90+ minute commute: 3.1%
— 60+ minute commute: 10.5%
– Average commute time: 29.2 minutes
— 0.6 minutes shorter than state average
– Left for work from 12 a.m. to 6 a.m.: 9.2%
– Worked outside county of residence: 12.5%
– Means of transportation: drove alone (71.0%), carpooled (10.2%), walked to work (2.1%), public transportation (4.0%), worked from home (9.7%)
You may also like: Best private high schools in California
Trance addict // Wikimedia Commons
#38. Glenn County
– Workers with 90+ minute commute: 3.2%
— 60+ minute commute: 4.7%
– Average commute time: 23.7 minutes
— 6.1 minutes shorter than state average
– Left for work from 12 a.m. to 6 a.m.: 21.9%
– Worked outside county of residence: 30.0%
– Means of transportation: drove alone (78.1%), carpooled (11.4%), walked to work (3.0%), public transportation (0.2%), worked from home (6.2%)
Scott Burley // Wikimedia Commons
#37. Modoc County
– Workers with 90+ minute commute: 3.2%
— 60+ minute commute: 4.9%
– Average commute time: 19.6 minutes
— 10.2 minutes shorter than state average
– Left for work from 12 a.m. to 6 a.m.: 12.2%
– Worked outside county of residence: 8.6%
– Means of transportation: drove alone (74.3%), carpooled (4.8%), walked to work (4.7%), public transportation (0.0%), worked from home (15.2%)
Doug Kerr // Wikicommons
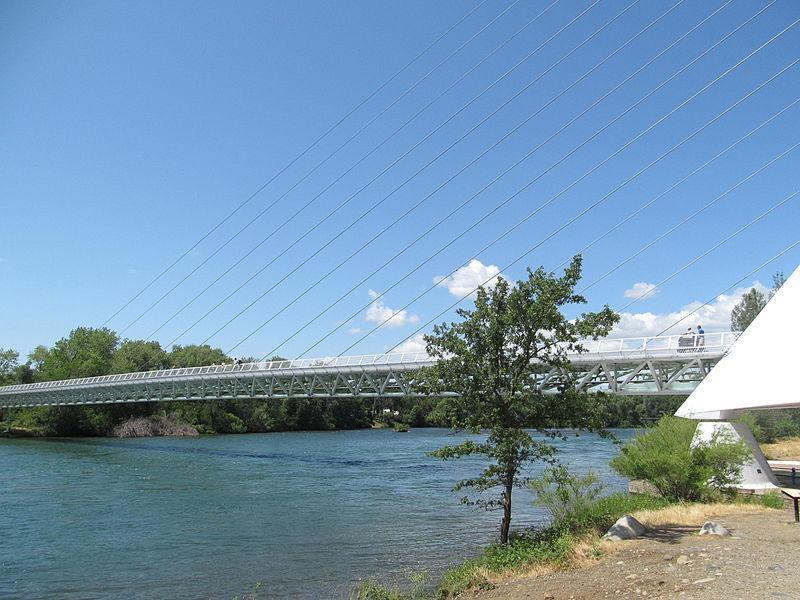
#36. Shasta County
– Workers with 90+ minute commute: 3.2%
— 60+ minute commute: 5.9%
– Average commute time: 21.4 minutes
— 8.4 minutes shorter than state average
– Left for work from 12 a.m. to 6 a.m.: 14.1%
– Worked outside county of residence: 6.8%
– Means of transportation: drove alone (81.0%), carpooled (8.6%), walked to work (2.1%), public transportation (0.6%), worked from home (6.2%)
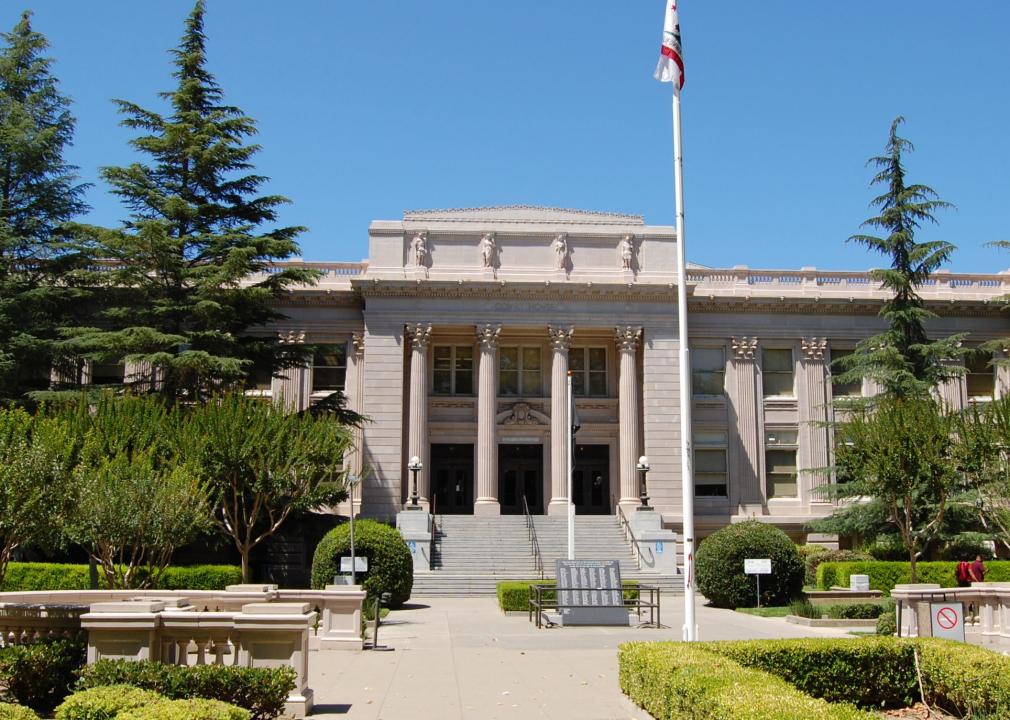
Epolk // Wikimedia Commons
#35. Yolo County
– Workers with 90+ minute commute: 3.3%
— 60+ minute commute: 7.4%
– Average commute time: 24.3 minutes
— 5.5 minutes shorter than state average
– Left for work from 12 a.m. to 6 a.m.: 14.1%
– Worked outside county of residence: 35.5%
– Means of transportation: drove alone (67.6%), carpooled (9.0%), walked to work (2.2%), public transportation (4.2%), worked from home (9.5%)
Canva
#34. Ventura County
– Workers with 90+ minute commute: 3.3%
— 60+ minute commute: 8.5%
– Average commute time: 26.9 minutes
— 2.9 minutes shorter than state average
– Left for work from 12 a.m. to 6 a.m.: 15.7%
– Worked outside county of residence: 20.1%
– Means of transportation: drove alone (77.7%), carpooled (10.2%), walked to work (1.6%), public transportation (1.0%), worked from home (8.3%)
You may also like: Highest-rated museums in California
Canva
#33. Sierra County
– Workers with 90+ minute commute: 3.3%
— 60+ minute commute: 14.0%
– Average commute time: 27.6 minutes
— 2.2 minutes shorter than state average
– Left for work from 12 a.m. to 6 a.m.: 18.6%
– Worked outside county of residence: 29.1%
– Means of transportation: drove alone (79.8%), carpooled (5.0%), walked to work (1.4%), public transportation (0.3%), worked from home (13.5%)
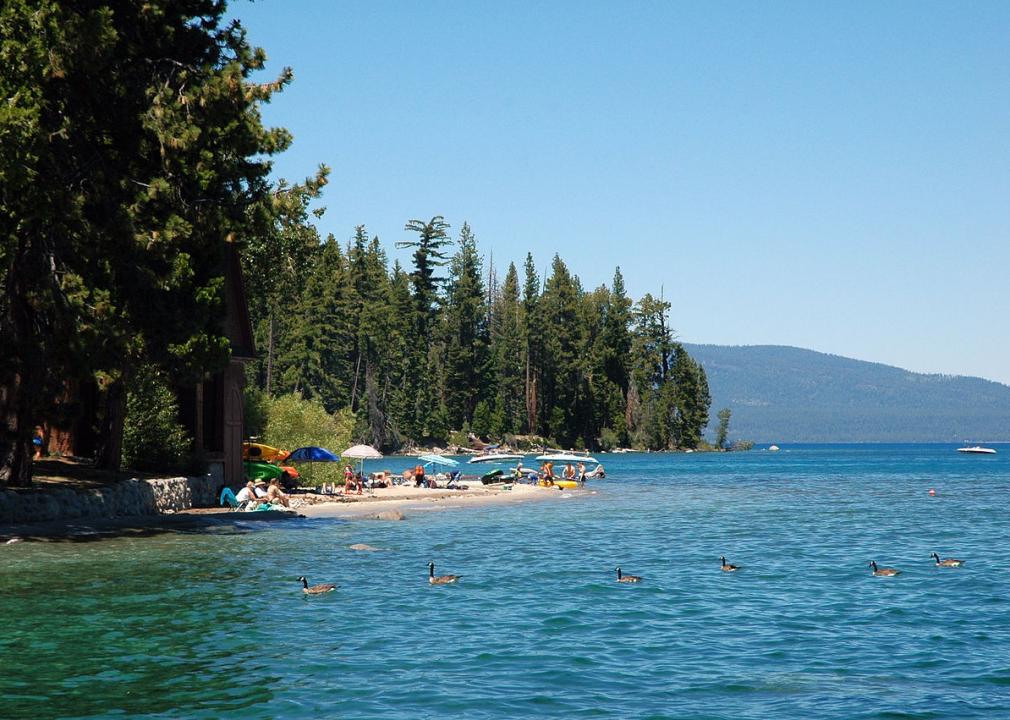
Doug Olson // Wikimedia Commons
#32. Placer County
– Workers with 90+ minute commute: 3.4%
— 60+ minute commute: 9.0%
– Average commute time: 27.6 minutes
— 2.2 minutes shorter than state average
– Left for work from 12 a.m. to 6 a.m.: 13.2%
– Worked outside county of residence: 34.2%
– Means of transportation: drove alone (77.1%), carpooled (6.5%), walked to work (1.1%), public transportation (1.0%), worked from home (13.0%)
Binksternet // Wikimedia Commons
#31. Mendocino County
– Workers with 90+ minute commute: 3.5%
— 60+ minute commute: 7.9%
– Average commute time: 20.7 minutes
— 9.1 minutes shorter than state average
– Left for work from 12 a.m. to 6 a.m.: 14.2%
– Worked outside county of residence: 6.7%
– Means of transportation: drove alone (73.4%), carpooled (10.0%), walked to work (6.1%), public transportation (0.2%), worked from home (9.2%)
U.S. Army Corps of Engineers Sacramento District // Wikimedia Commons
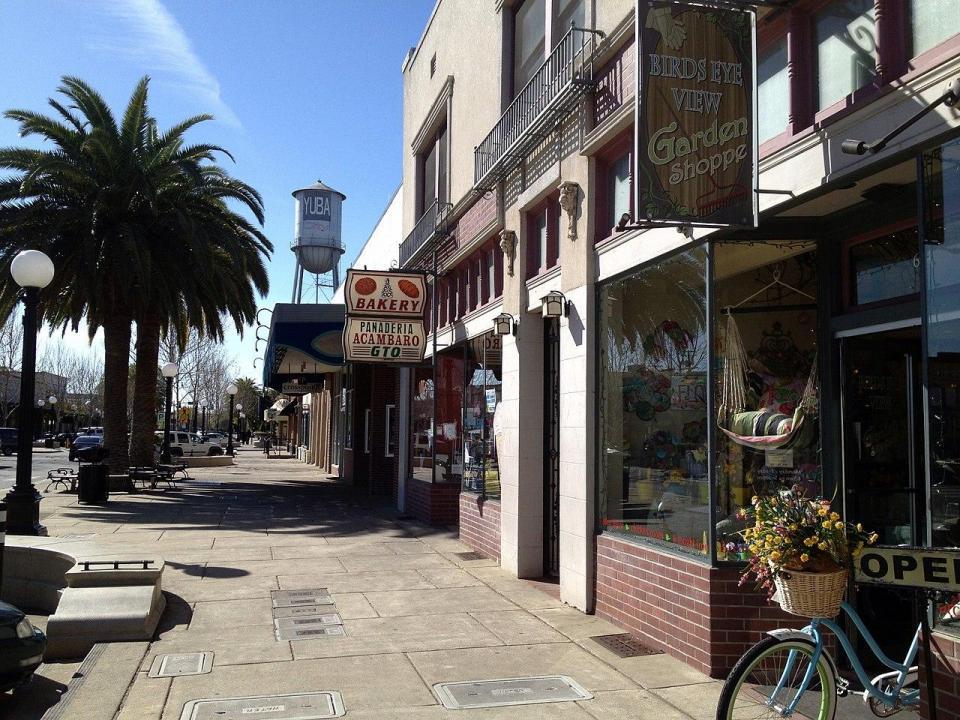
#30. Yuba County
– Workers with 90+ minute commute: 3.6%
— 60+ minute commute: 11.3%
– Average commute time: 30.3 minutes
— 0.5 minutes longer than state average
– Left for work from 12 a.m. to 6 a.m.: 23.2%
– Worked outside county of residence: 55.2%
– Means of transportation: drove alone (79.9%), carpooled (11.6%), walked to work (1.4%), public transportation (0.6%), worked from home (5.3%)

Stan Shebs // Wikicommons
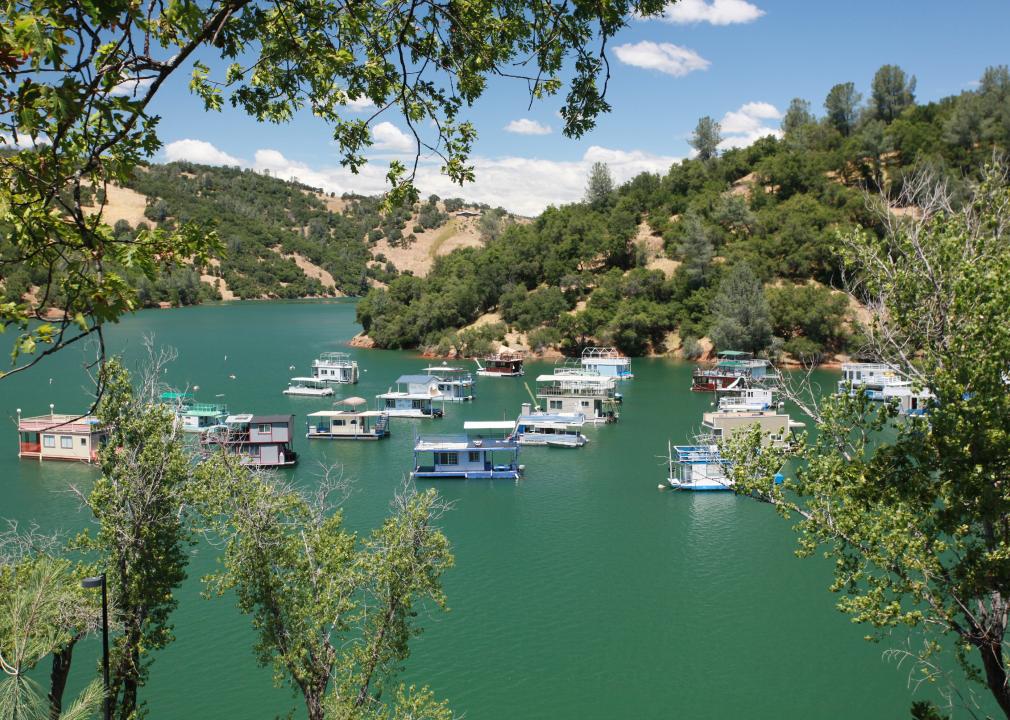
#29. Napa County
– Workers with 90+ minute commute: 3.6%
— 60+ minute commute: 10.4%
– Average commute time: 25.4 minutes
— 4.4 minutes shorter than state average
– Left for work from 12 a.m. to 6 a.m.: 13.1%
– Worked outside county of residence: 21.1%
– Means of transportation: drove alone (74.9%), carpooled (10.5%), walked to work (3.5%), public transportation (1.4%), worked from home (7.3%)
You may also like: Counties with the oldest homes in California

Canva
#28. Sacramento County
– Workers with 90+ minute commute: 3.6%
— 60+ minute commute: 8.2%
– Average commute time: 28.1 minutes
— 1.7 minutes shorter than state average
– Left for work from 12 a.m. to 6 a.m.: 14.5%
– Worked outside county of residence: 19.1%
– Means of transportation: drove alone (74.9%), carpooled (9.9%), walked to work (1.8%), public transportation (2.2%), worked from home (9.0%)
Fred Hsu // Wikicommons
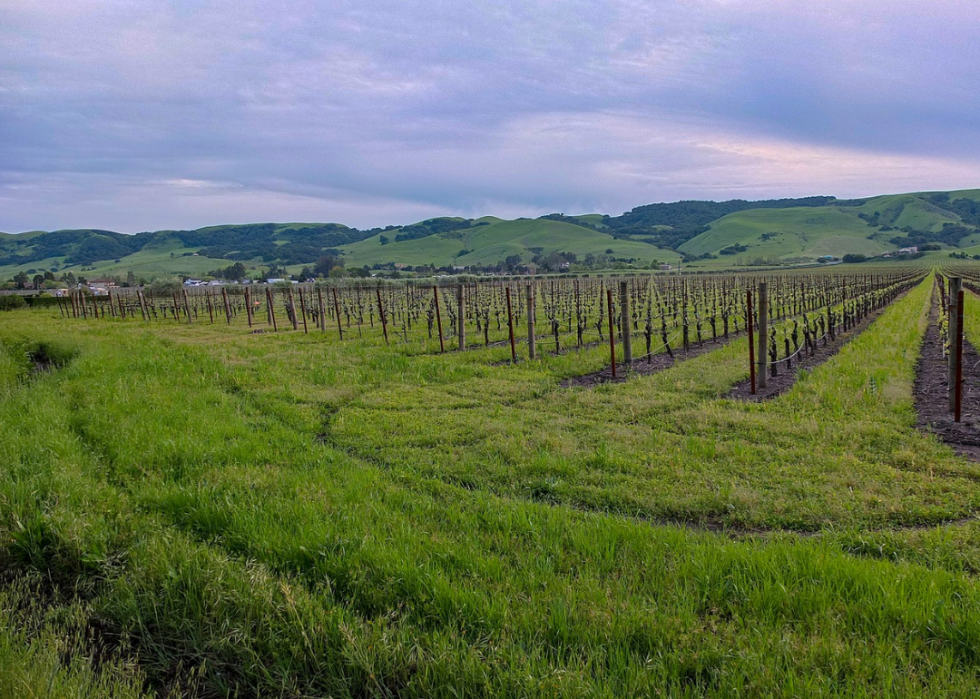
#27. Sonoma County
– Workers with 90+ minute commute: 3.7%
— 60+ minute commute: 9.6%
– Average commute time: 25.6 minutes
— 4.2 minutes shorter than state average
– Left for work from 12 a.m. to 6 a.m.: 13.3%
– Worked outside county of residence: 14.1%
– Means of transportation: drove alone (74.2%), carpooled (10.4%), walked to work (2.5%), public transportation (1.6%), worked from home (9.1%)
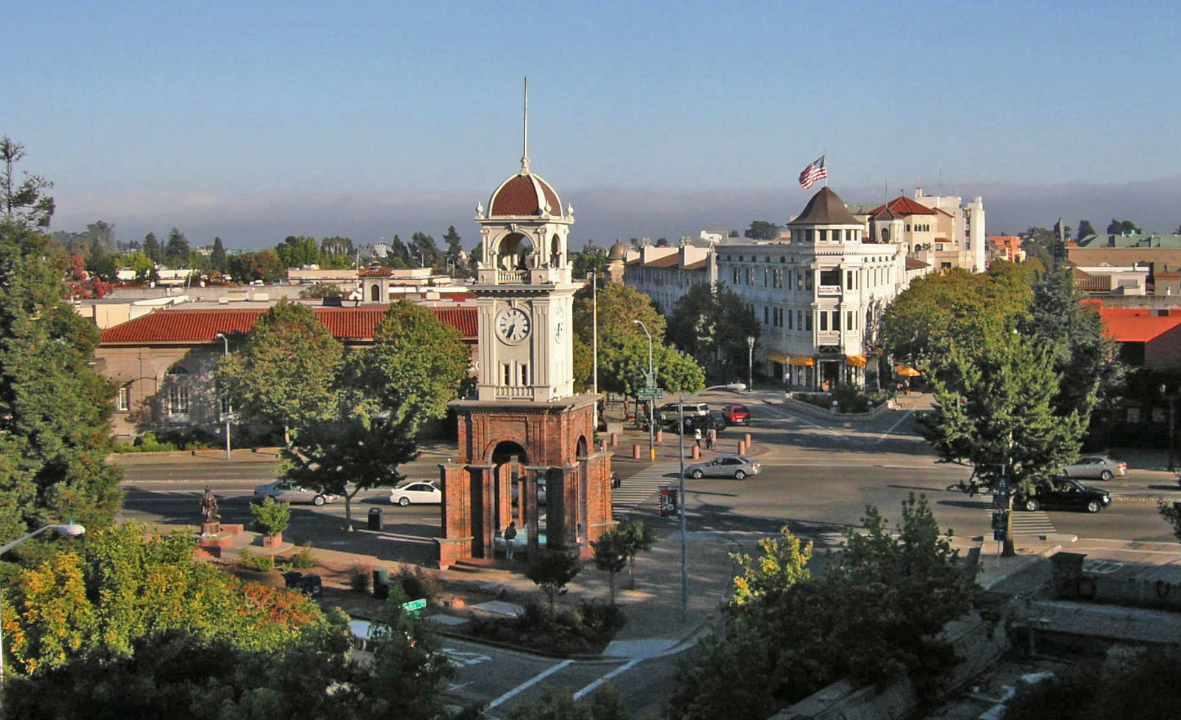
Aaronbrick // Wikicommons
#26. Santa Cruz County
– Workers with 90+ minute commute: 3.8%
— 60+ minute commute: 12.6%
– Average commute time: 27.5 minutes
— 2.3 minutes shorter than state average
– Left for work from 12 a.m. to 6 a.m.: 10.3%
– Worked outside county of residence: 21.9%
– Means of transportation: drove alone (68.1%), carpooled (8.6%), walked to work (4.9%), public transportation (2.2%), worked from home (10.9%)

Canva
#25. San Francisco
– Workers with 90+ minute commute: 3.8%
— 60+ minute commute: 14.4%
– Average commute time: 33.3 minutes
— 3.5 minutes longer than state average
– Left for work from 12 a.m. to 6 a.m.: 5.7%
– Worked outside county of residence: 20.8%
– Means of transportation: drove alone (30.5%), carpooled (6.8%), walked to work (11.7%), public transportation (31.6%), worked from home (11.8%)
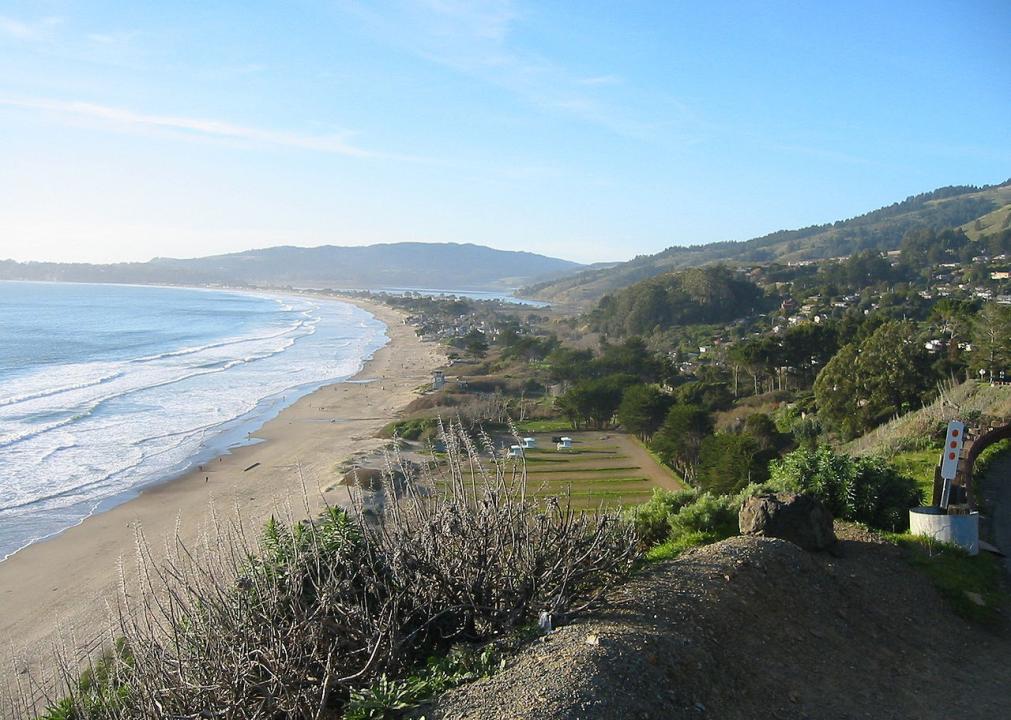
Kglavin // Wikimedia Commons
#24. Marin County
– Workers with 90+ minute commute: 3.8%
— 60+ minute commute: 16.4%
– Average commute time: 31.8 minutes
— 2.0 minutes longer than state average
– Left for work from 12 a.m. to 6 a.m.: 8.0%
– Worked outside county of residence: 33.4%
– Means of transportation: drove alone (62.5%), carpooled (7.5%), walked to work (3.2%), public transportation (7.9%), worked from home (16.8%)
You may also like: Most popular girl names in the 60s in California
Frank Schulenburg // Wikimedia Commons
#23. Tehama County
– Workers with 90+ minute commute: 3.8%
— 60+ minute commute: 7.6%
– Average commute time: 24.4 minutes
— 5.4 minutes shorter than state average
– Left for work from 12 a.m. to 6 a.m.: 21.0%
– Worked outside county of residence: 25.9%
– Means of transportation: drove alone (81.5%), carpooled (9.8%), walked to work (1.8%), public transportation (0.4%), worked from home (5.4%)
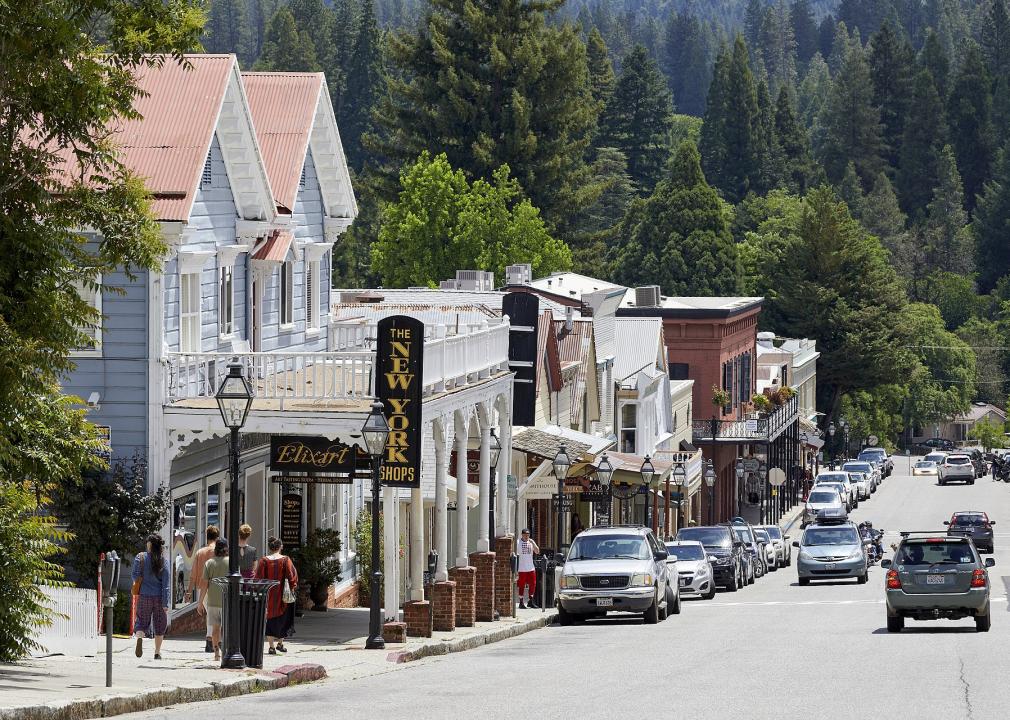
Frank Schulenburg // Wikimedia Commons
#22. Nevada County
– Workers with 90+ minute commute: 3.9%
— 60+ minute commute: 8.5%
– Average commute time: 24.7 minutes
— 5.1 minutes shorter than state average
– Left for work from 12 a.m. to 6 a.m.: 10.7%
– Worked outside county of residence: 22.7%
– Means of transportation: drove alone (72.2%), carpooled (6.6%), walked to work (2.6%), public transportation (0.2%), worked from home (16.2%)
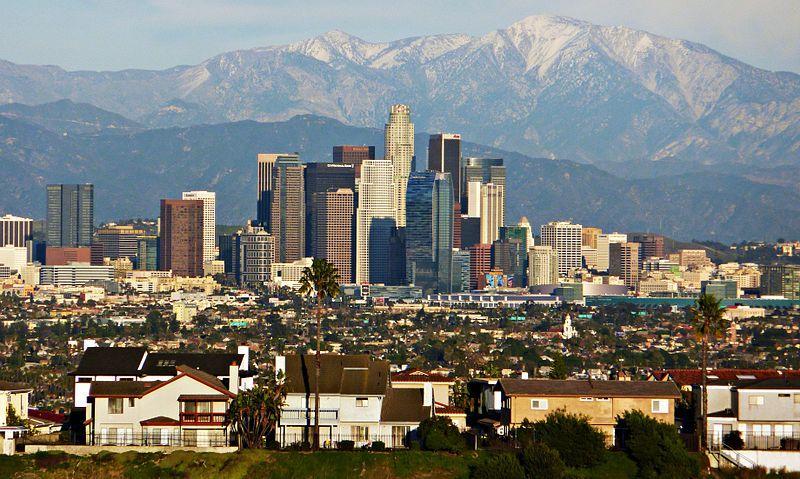
BDS2006 // Wikimedia
#21. Los Angeles County
– Workers with 90+ minute commute: 4.0%
— 60+ minute commute: 14.6%
– Average commute time: 31.7 minutes
— 1.9 minutes longer than state average
– Left for work from 12 a.m. to 6 a.m.: 14.7%
– Worked outside county of residence: 7.0%
– Means of transportation: drove alone (72.1%), carpooled (9.5%), walked to work (2.6%), public transportation (5.4%), worked from home (8.0%)
Almonroth // Wikimedia Commons
#20. Trinity County
– Workers with 90+ minute commute: 4.3%
— 60+ minute commute: 10.0%
– Average commute time: 24.7 minutes
— 5.1 minutes shorter than state average
– Left for work from 12 a.m. to 6 a.m.: 18.6%
– Worked outside county of residence: 10.4%
– Means of transportation: drove alone (69.5%), carpooled (7.6%), walked to work (2.0%), public transportation (1.5%), worked from home (16.0%)
Ray Bouknight // Wikicommons
#19. Sutter County
– Workers with 90+ minute commute: 4.3%
— 60+ minute commute: 12.4%
– Average commute time: 28.7 minutes
— 1.1 minutes shorter than state average
– Left for work from 12 a.m. to 6 a.m.: 22.2%
– Worked outside county of residence: 44.9%
– Means of transportation: drove alone (78.2%), carpooled (12.1%), walked to work (1.2%), public transportation (1.0%), worked from home (6.3%)
You may also like: Best counties to raise a family in California
DimiTalen // Wikimedia Commons
#18. El Dorado County
– Workers with 90+ minute commute: 4.4%
— 60+ minute commute: 12.1%
– Average commute time: 28.9 minutes
— 0.9 minutes shorter than state average
– Left for work from 12 a.m. to 6 a.m.: 13.2%
– Worked outside county of residence: 36.0%
– Means of transportation: drove alone (76.0%), carpooled (7.9%), walked to work (1.6%), public transportation (1.1%), worked from home (11.6%)
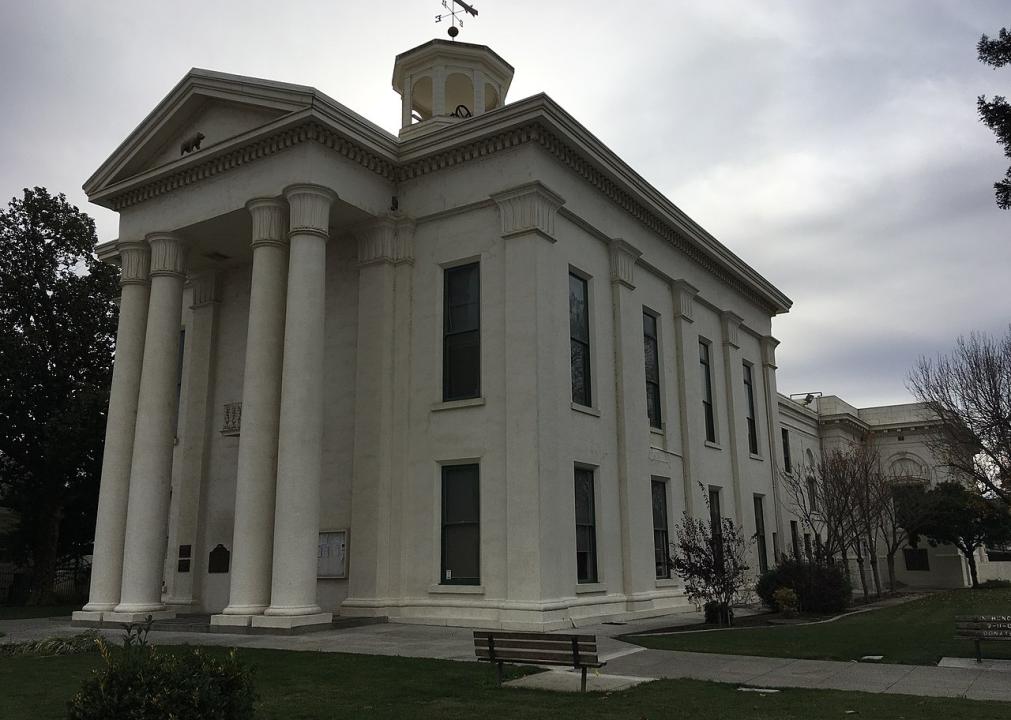
CleanWater17 // Wikimedia Commons
#17. Colusa County
– Workers with 90+ minute commute: 4.8%
— 60+ minute commute: 11.9%
– Average commute time: 25.3 minutes
— 4.5 minutes shorter than state average
– Left for work from 12 a.m. to 6 a.m.: 28.7%
– Worked outside county of residence: 31.2%
– Means of transportation: drove alone (79.9%), carpooled (12.5%), walked to work (1.5%), public transportation (0.1%), worked from home (4.6%)
Public Domain
#16. Madera County
– Workers with 90+ minute commute: 4.8%
— 60+ minute commute: 11.4%
– Average commute time: 28.5 minutes
— 1.3 minutes shorter than state average
– Left for work from 12 a.m. to 6 a.m.: 26.8%
– Worked outside county of residence: 36.4%
– Means of transportation: drove alone (74.7%), carpooled (14.0%), walked to work (1.9%), public transportation (0.4%), worked from home (4.9%)

Susan Popielaski // Wikimedia Commons
#15. Alpine County
– Workers with 90+ minute commute: 5.0%
— 60+ minute commute: 6.9%
– Average commute time: 23.7 minutes
— 6.1 minutes shorter than state average
– Left for work from 12 a.m. to 6 a.m.: 12.2%
– Worked outside county of residence: 12.6%
– Means of transportation: drove alone (52.0%), carpooled (10.1%), walked to work (2.8%), public transportation (1.0%), worked from home (34.2%)
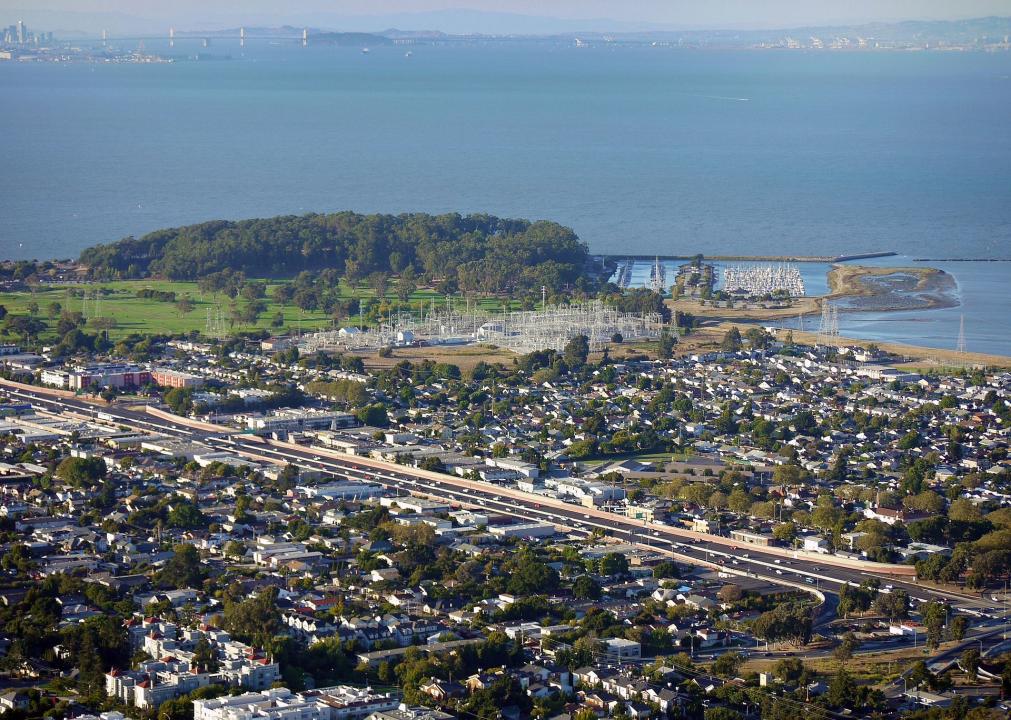
Jennifer Williams // Wikimedia Commons
#14. Alameda County
– Workers with 90+ minute commute: 5.0%
— 60+ minute commute: 18.1%
– Average commute time: 34.2 minutes
— 4.4 minutes longer than state average
– Left for work from 12 a.m. to 6 a.m.: 10.9%
– Worked outside county of residence: 34.5%
– Means of transportation: drove alone (58.5%), carpooled (9.5%), walked to work (3.3%), public transportation (14.3%), worked from home (11.0%)
You may also like: Zip codes with the most expensive homes in California
Bobak Ha’Eri // Wikimedia Commons
#13. Amador County
– Workers with 90+ minute commute: 6.0%
— 60+ minute commute: 14.8%
– Average commute time: 30.6 minutes
— 0.8 minutes longer than state average
– Left for work from 12 a.m. to 6 a.m.: 20.9%
– Worked outside county of residence: 31.3%
– Means of transportation: drove alone (79.2%), carpooled (7.5%), walked to work (1.9%), public transportation (0.3%), worked from home (9.6%)
Canva
#12. San Bernardino County
– Workers with 90+ minute commute: 6.8%
— 60+ minute commute: 16.4%
– Average commute time: 32.3 minutes
— 2.5 minutes longer than state average
– Left for work from 12 a.m. to 6 a.m.: 23.7%
– Worked outside county of residence: 27.9%
– Means of transportation: drove alone (78.4%), carpooled (11.2%), walked to work (1.6%), public transportation (1.3%), worked from home (6.2%)
![]()
CFang // Wikimedia Commons
#11. Lake County
– Workers with 90+ minute commute: 7.1%
— 60+ minute commute: 15.5%
– Average commute time: 30.6 minutes
— 0.8 minutes longer than state average
– Left for work from 12 a.m. to 6 a.m.: 18.1%
– Worked outside county of residence: 24.0%
– Means of transportation: drove alone (69.6%), carpooled (11.2%), walked to work (2.5%), public transportation (0.7%), worked from home (14.9%)
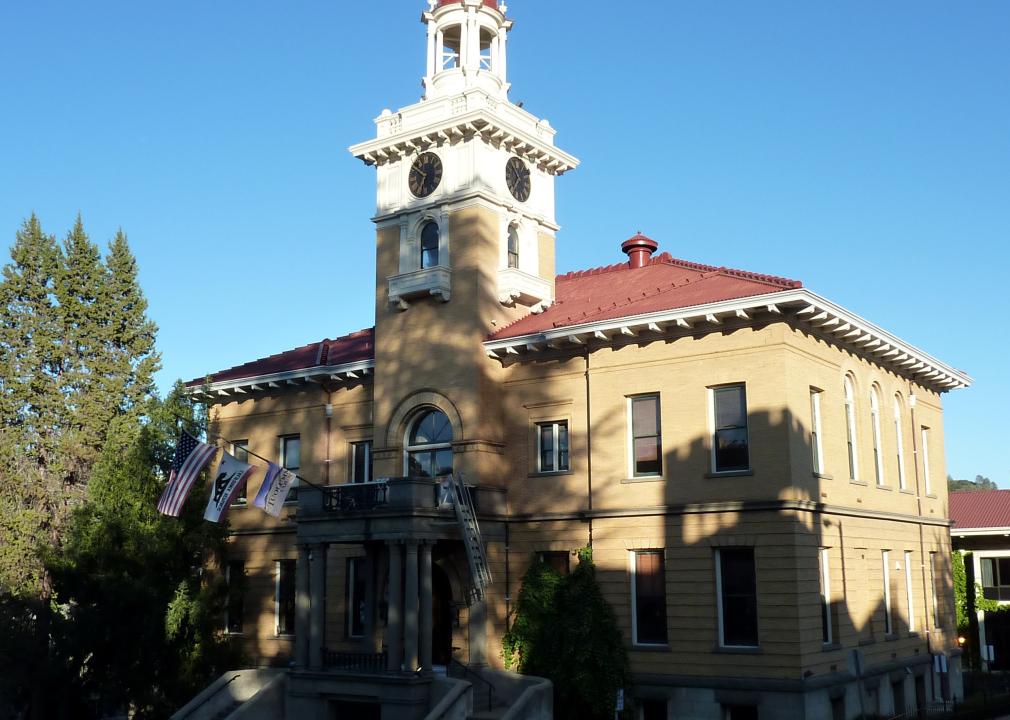
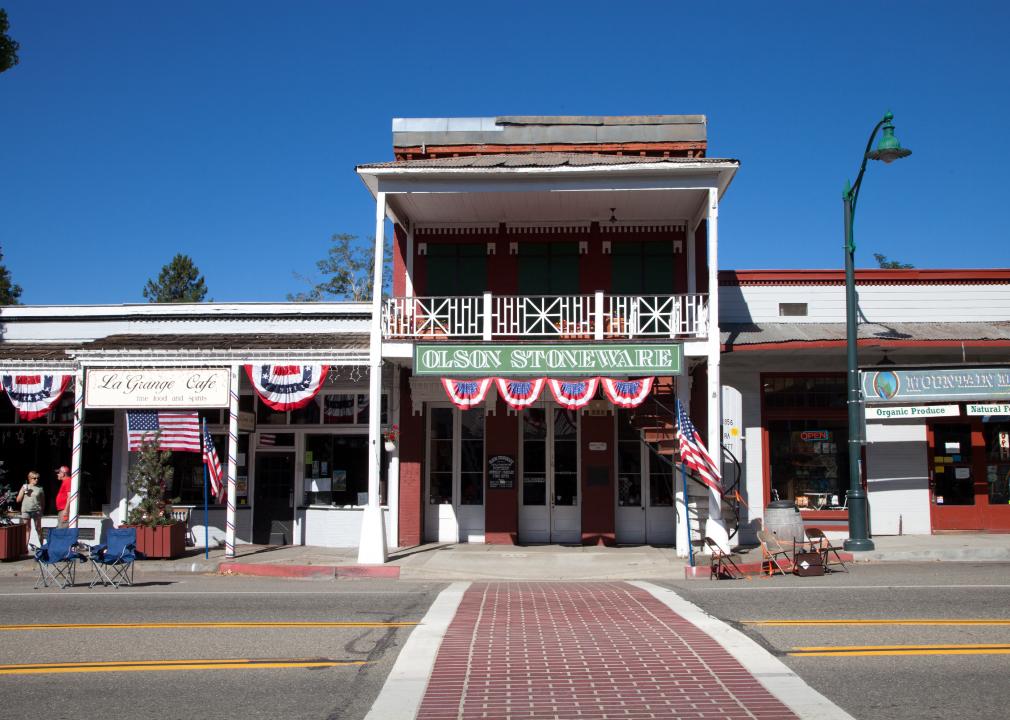
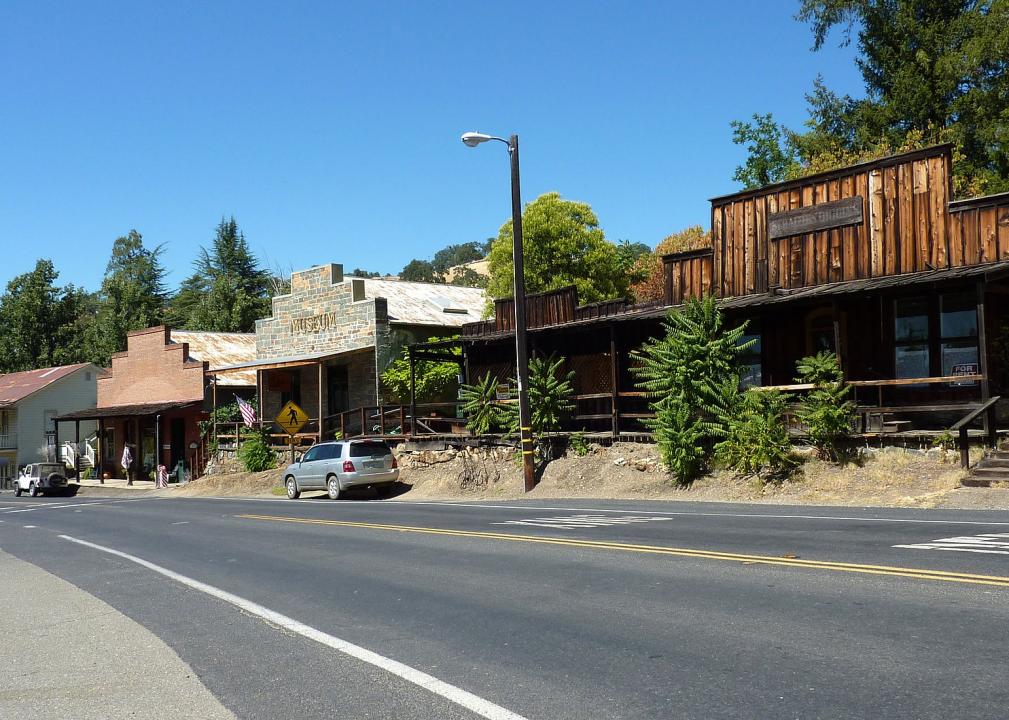
Bobak Ha’Eri // Wikimedia Commons
#10. Tuolumne County
– Workers with 90+ minute commute: 7.1%
— 60+ minute commute: 14.7%
– Average commute time: 28.1 minutes
— 1.7 minutes shorter than state average
– Left for work from 12 a.m. to 6 a.m.: 13.3%
– Worked outside county of residence: 16.6%
– Means of transportation: drove alone (80.4%), carpooled (8.3%), walked to work (2.7%), public transportation (0.5%), worked from home (6.8%)
Canva
#9. Solano County
– Workers with 90+ minute commute: 7.2%
— 60+ minute commute: 18.8%
– Average commute time: 33.2 minutes
— 3.4 minutes longer than state average
– Left for work from 12 a.m. to 6 a.m.: 22.6%
– Worked outside county of residence: 41.0%
– Means of transportation: drove alone (75.9%), carpooled (12.7%), walked to work (1.2%), public transportation (2.7%), worked from home (6.4%)
You may also like: What California’s immigrant population looked like in 1900
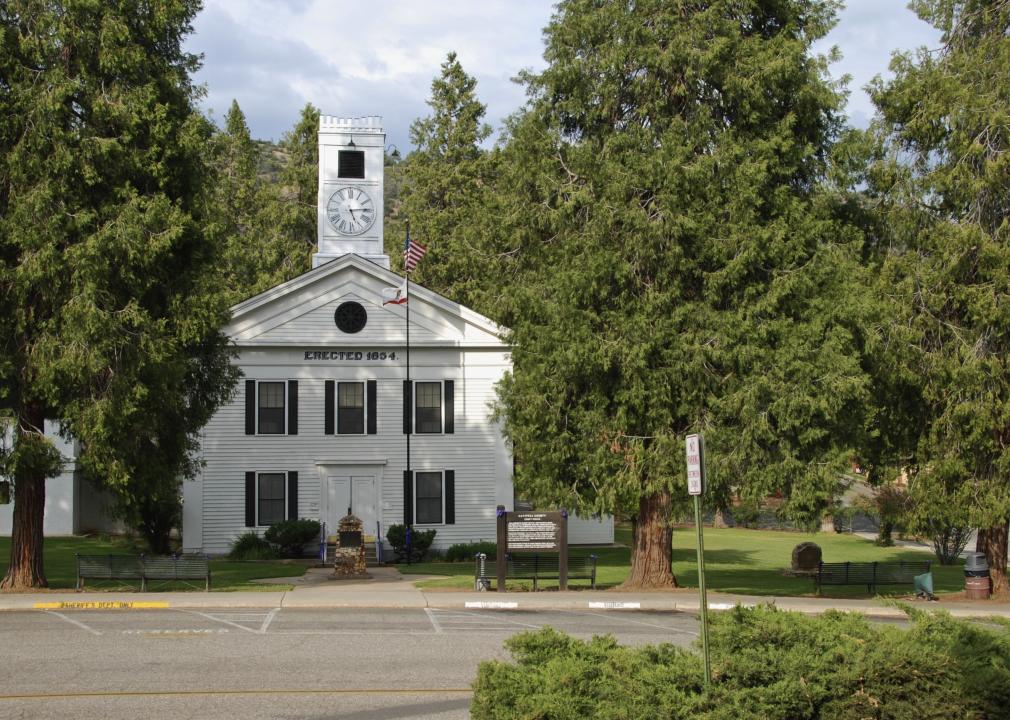
EPoelzl // Wikimedia Commons
#8. Mariposa County
– Workers with 90+ minute commute: 7.7%
— 60+ minute commute: 13.8%
– Average commute time: 31 minutes
— 1.2 minutes longer than state average
– Left for work from 12 a.m. to 6 a.m.: 18.2%
– Worked outside county of residence: 22.7%
– Means of transportation: drove alone (61.0%), carpooled (14.5%), walked to work (11.8%), public transportation (1.5%), worked from home (8.5%)
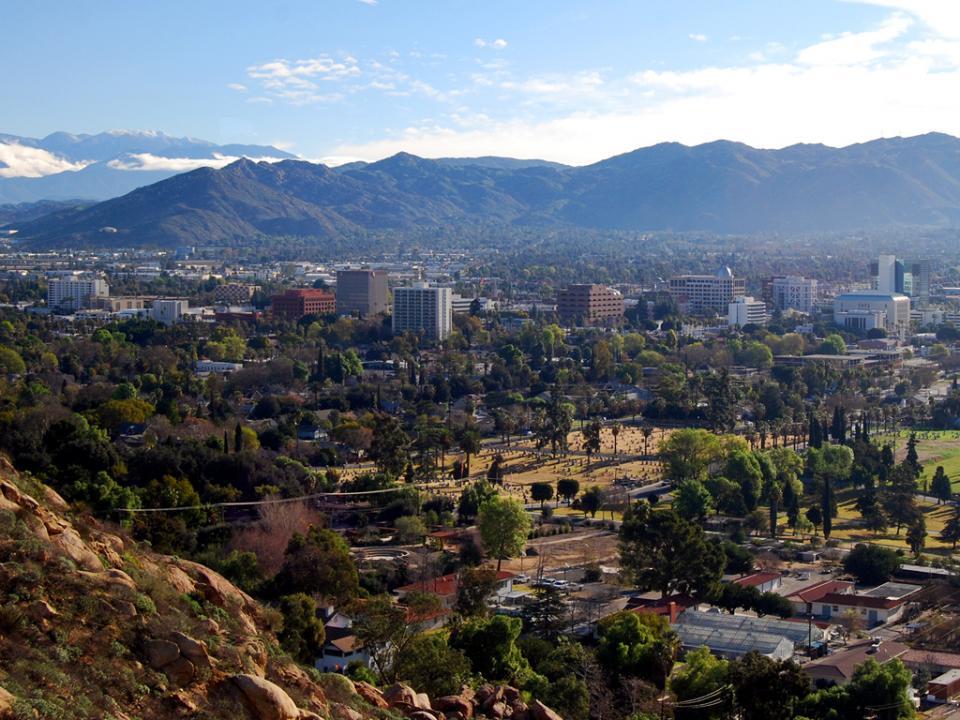
Daniel Orth // Flickr
#7. Riverside County
– Workers with 90+ minute commute: 7.8%
— 60+ minute commute: 19.1%
– Average commute time: 34.1 minutes
— 4.3 minutes longer than state average
– Left for work from 12 a.m. to 6 a.m.: 24.1%
– Worked outside county of residence: 28.7%
– Means of transportation: drove alone (77.9%), carpooled (11.7%), walked to work (1.3%), public transportation (1.1%), worked from home (6.3%)
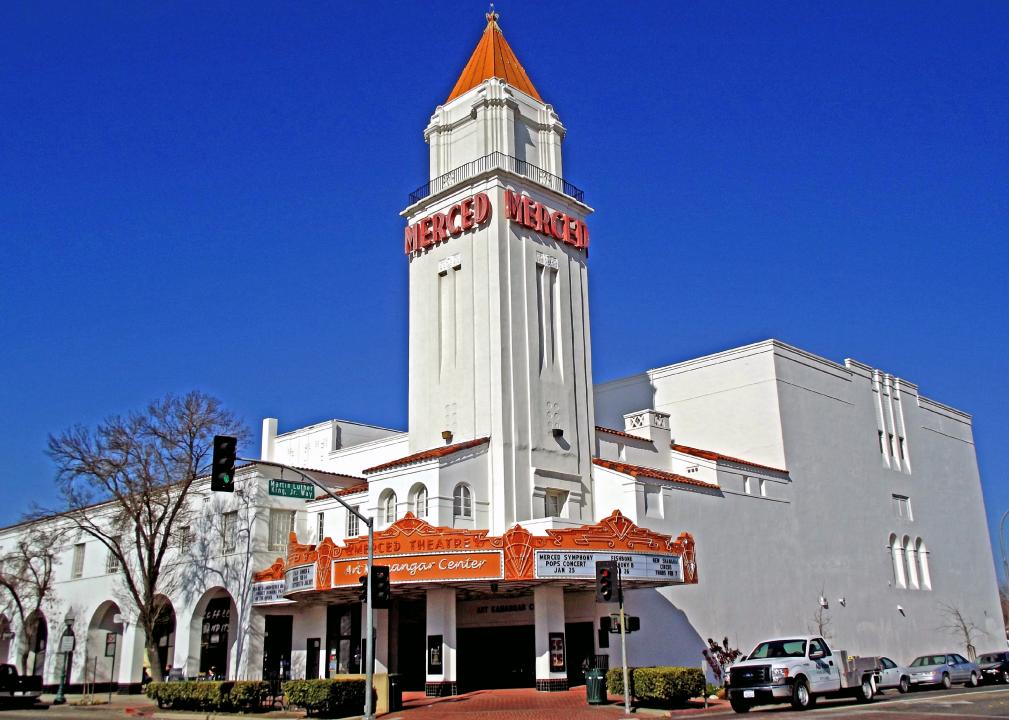
Mark Miller // Wikimedia Commons
#6. Merced County
– Workers with 90+ minute commute: 8.7%
— 60+ minute commute: 15.0%
– Average commute time: 28.9 minutes
— 0.9 minutes shorter than state average
– Left for work from 12 a.m. to 6 a.m.: 26.4%
– Worked outside county of residence: 29.7%
– Means of transportation: drove alone (79.3%), carpooled (9.0%), walked to work (2.4%), public transportation (0.9%), worked from home (3.8%)
Canva
#5. Calaveras County
– Workers with 90+ minute commute: 8.7%
— 60+ minute commute: 23.5%
– Average commute time: 38.7 minutes
— 8.9 minutes longer than state average
– Left for work from 12 a.m. to 6 a.m.: 19.5%
– Worked outside county of residence: 46.2%
– Means of transportation: drove alone (76.0%), carpooled (10.3%), walked to work (1.4%), public transportation (0.8%), worked from home (10.8%)
Public Domain
#4. Stanislaus County
– Workers with 90+ minute commute: 8.7%
— 60+ minute commute: 14.0%
– Average commute time: 30.6 minutes
— 0.8 minutes longer than state average
– Left for work from 12 a.m. to 6 a.m.: 22.2%
– Worked outside county of residence: 26.3%
– Means of transportation: drove alone (80.6%), carpooled (10.4%), walked to work (1.3%), public transportation (0.8%), worked from home (5.6%)
MARELBU // Wikimedia Commons
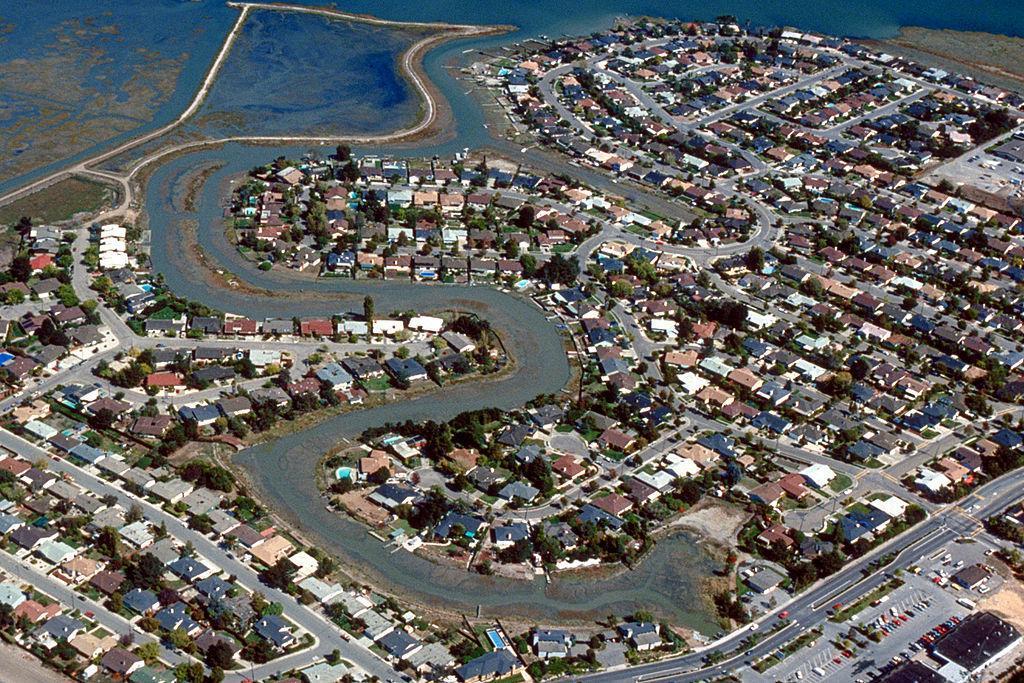
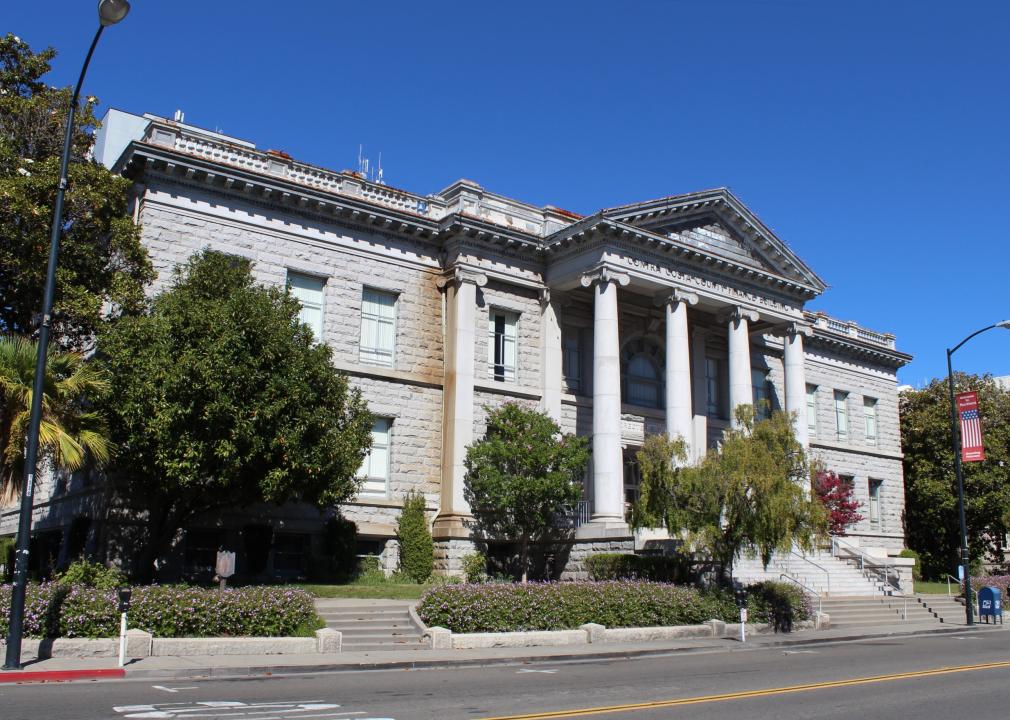
#3. Contra Costa County
– Workers with 90+ minute commute: 9.1%
— 60+ minute commute: 25.5%
– Average commute time: 38.5 minutes
— 8.7 minutes longer than state average
– Left for work from 12 a.m. to 6 a.m.: 16.8%
– Worked outside county of residence: 40.6%
– Means of transportation: drove alone (65.7%), carpooled (10.7%), walked to work (1.6%), public transportation (10.3%), worked from home (9.9%)
Michael Patrick // Wikimedia Commons
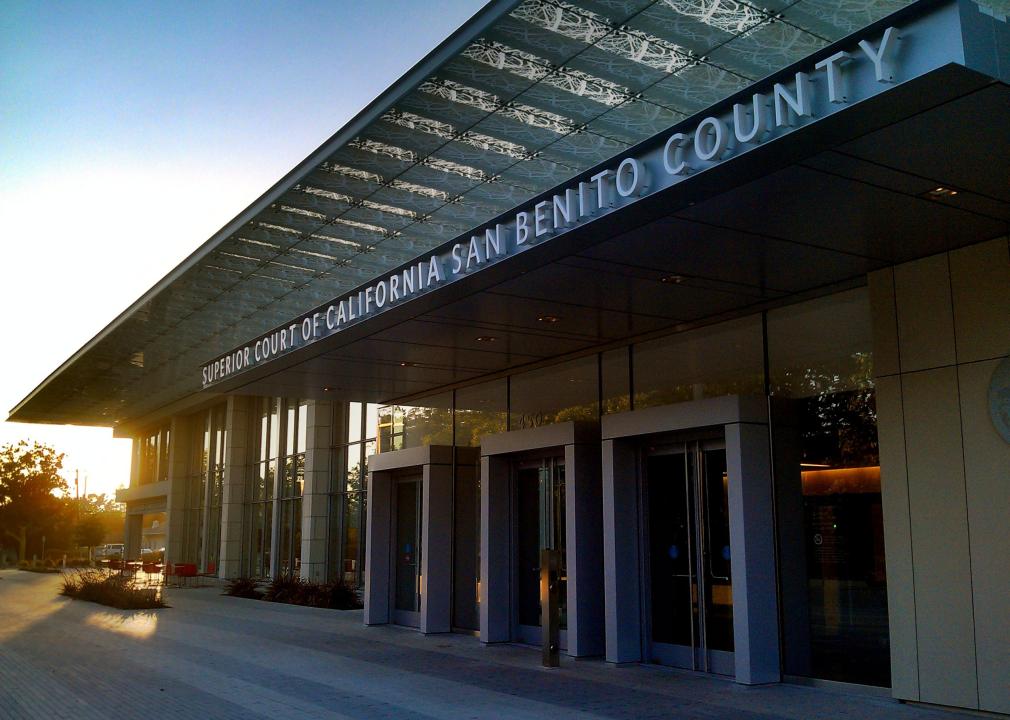
#2. San Benito County
– Workers with 90+ minute commute: 9.1%
— 60+ minute commute: 24.4%
– Average commute time: 36.3 minutes
— 6.5 minutes longer than state average
– Left for work from 12 a.m. to 6 a.m.: 24.0%
– Worked outside county of residence: 54.6%
– Means of transportation: drove alone (77.7%), carpooled (13.3%), walked to work (1.1%), public transportation (0.6%), worked from home (5.5%)

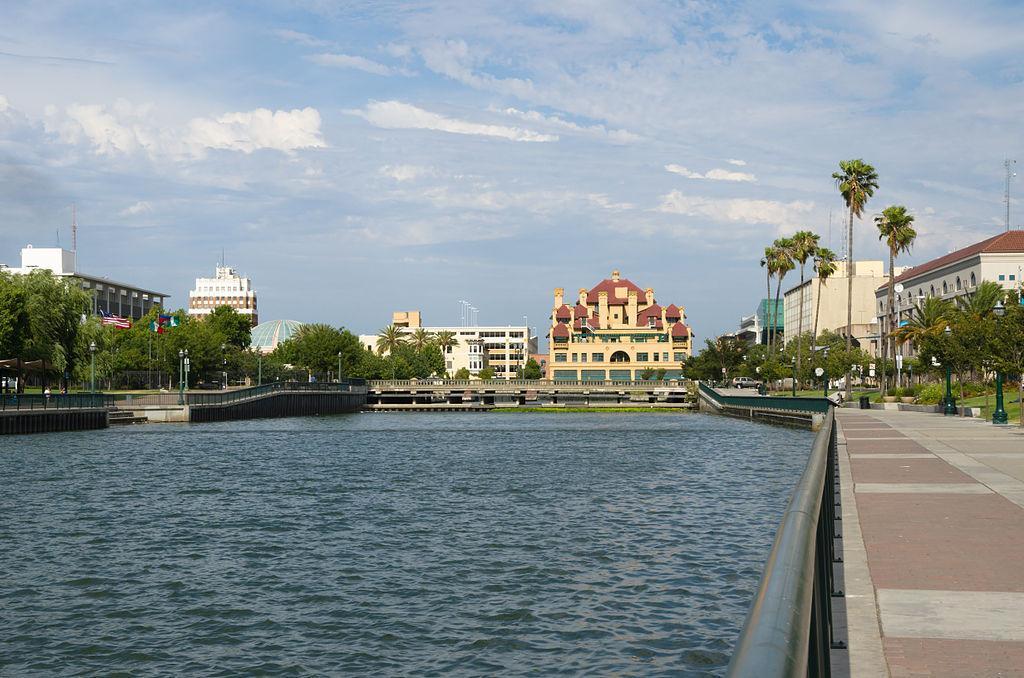
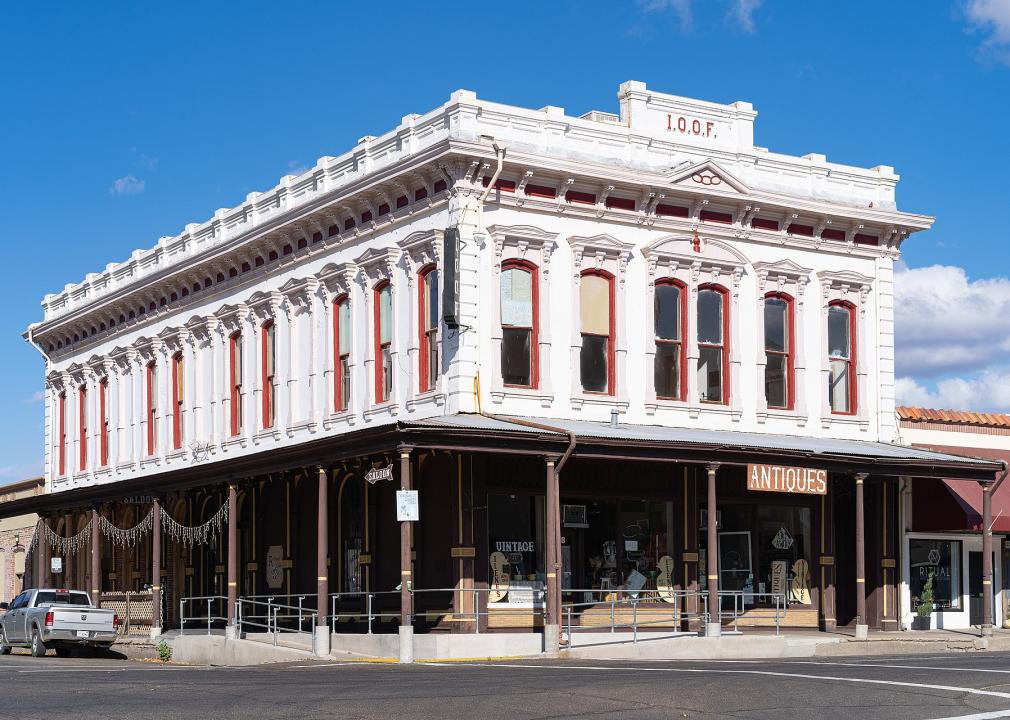
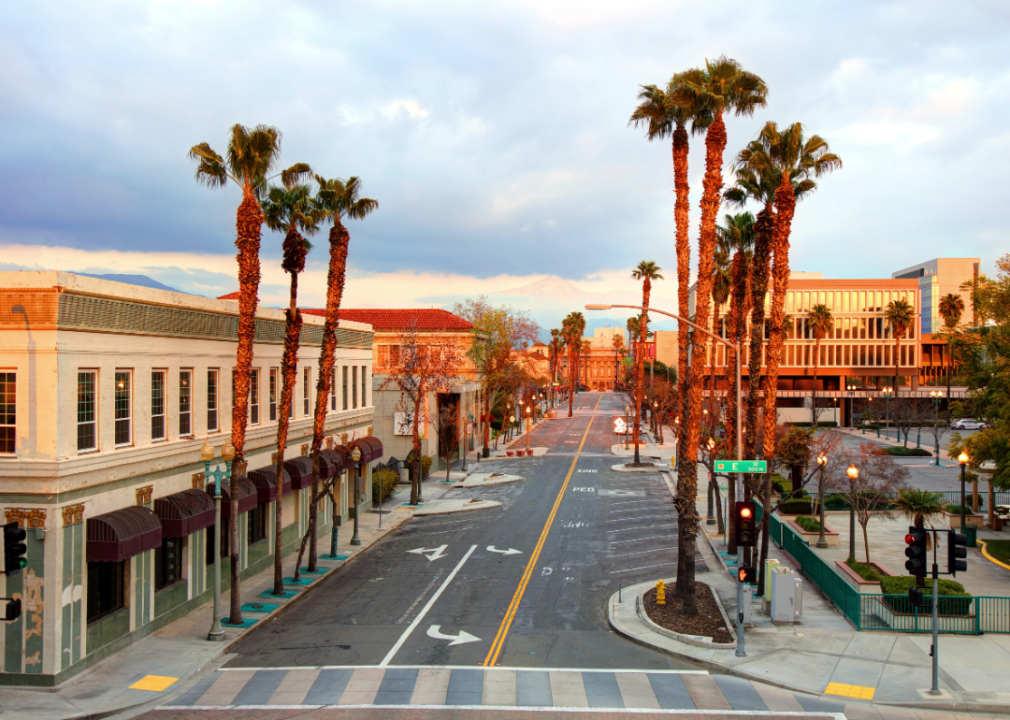
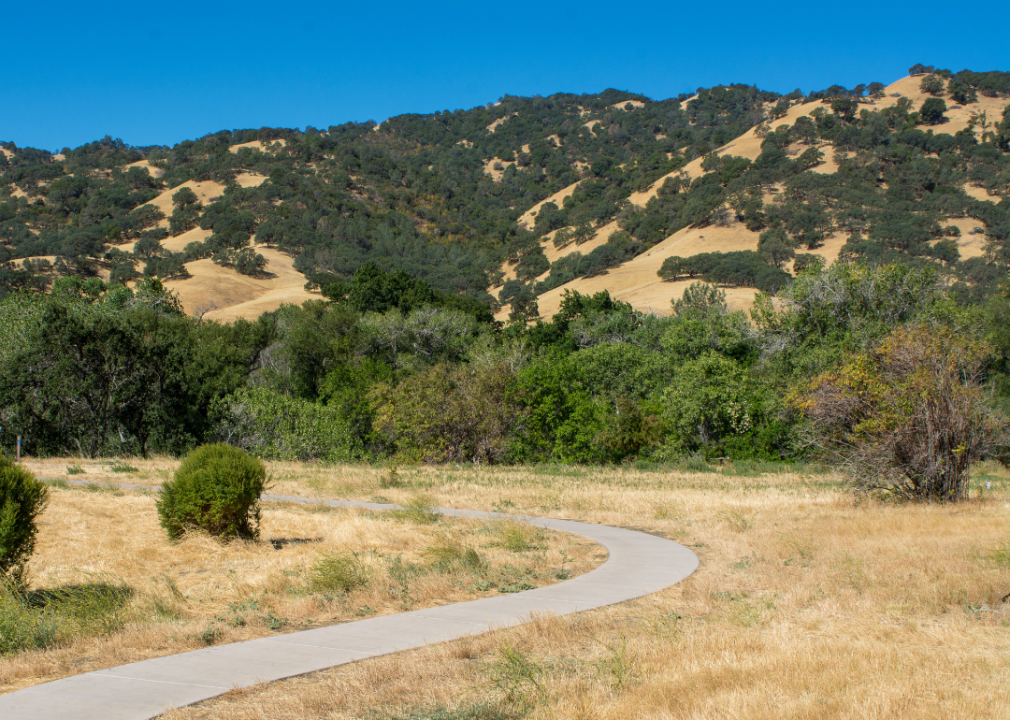
LPS.1 // Wikicommons
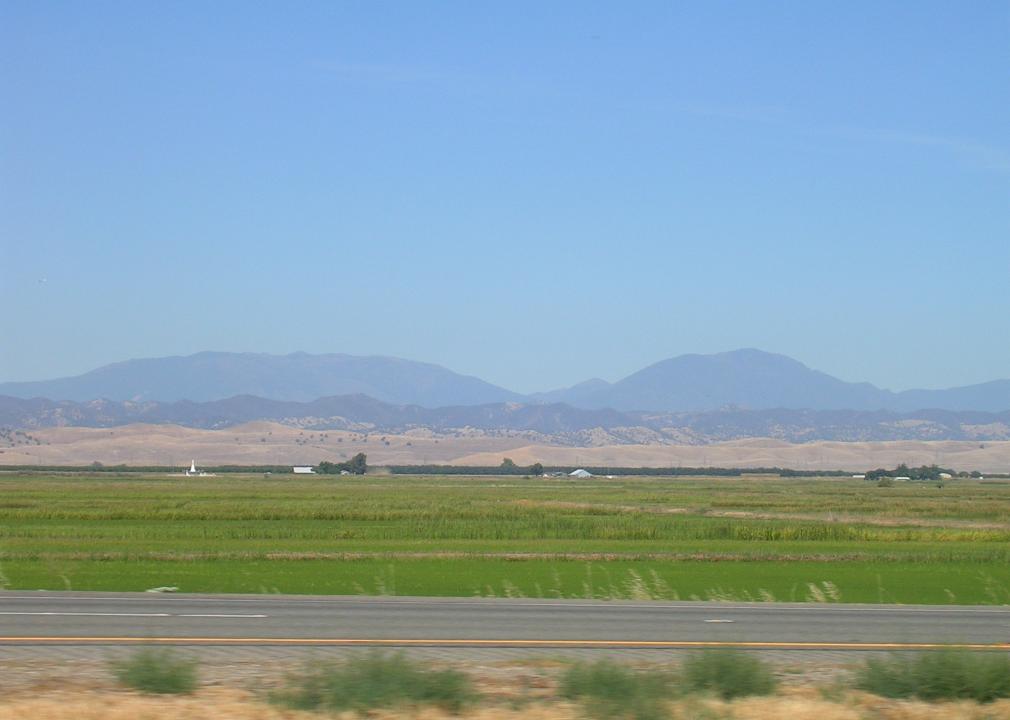
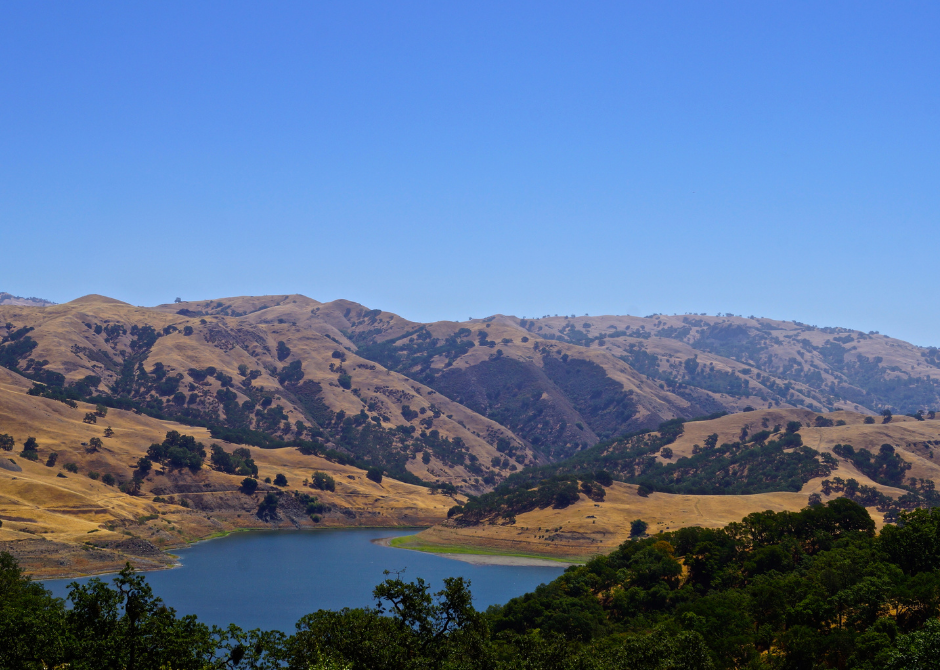
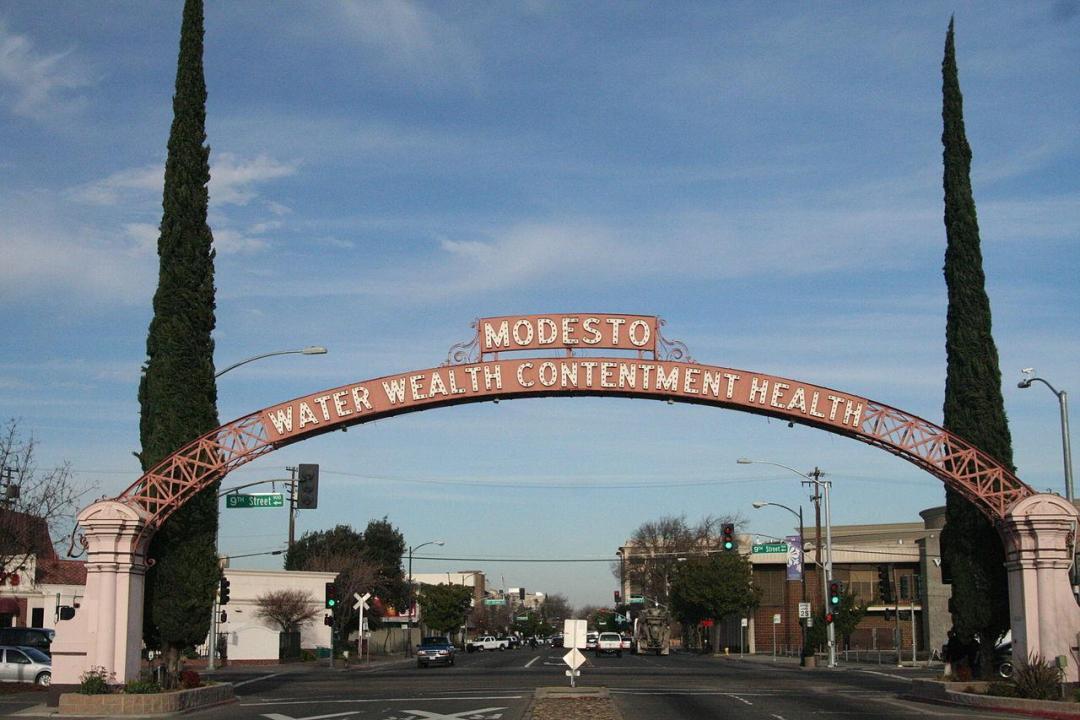
#1. San Joaquin County
– Workers with 90+ minute commute: 11.0%
— 60+ minute commute: 21.9%
– Average commute time: 35.2 minutes
— 5.4 minutes longer than state average
– Left for work from 12 a.m. to 6 a.m.: 23.6%
– Worked outside county of residence: 28.7%
– Means of transportation: drove alone (78.6%), carpooled (12.2%), walked to work (1.3%), public transportation (1.6%), worked from home (5.2%)